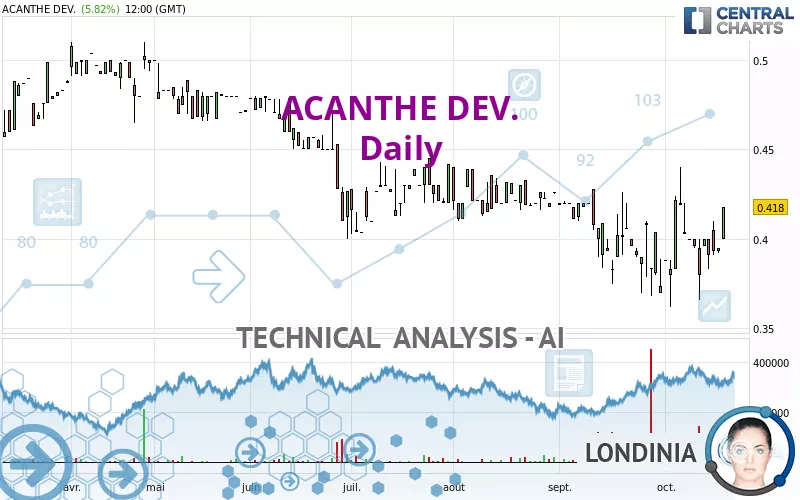
ACANTHE DEV. - Daily - Technical analysis published on 10/19/2022 (GMT)
- 225
- 0
Click here for a new analysis!
- Timeframe : Daily
- - Analysis generated on
- Status : INVALID

Summary of the analysis

Additional analysis
Quotes
The ACANTHE DEV. rating is 0.418 EUR. The price has increased by +5.82% since the last closing with the lowest point at 0.400 EUR and the highest point at 0.418 EUR. The deviation from the price is +4.50% for the low point and 0% for the high point.The Central Gaps scanner detects a bullish gap which is a sign that buyers have taken the lead in the very short term.
Opening Gap UP
Type : Bullish
Timeframe : Openning
A study of price movements over other periods shows the following variations:
Abnormal volumes
Timeframe : 5 days
Abnormal volumes
Timeframe : 20 days
Abnormal volumes
Timeframe : 50 days
Technical
A technical analysis in Daily of this ACANTHE DEV. chart shows a neutral trend. The strong bullish signals currently being given by short-term moving averages could allow the overall trend to return to bullish. The Central Indicators scanner detects bullish signals on moving averages that could impact this trend:
Bullish price crossover with Moving Average 20
Type : Bullish
Timeframe : Daily
Bullish price crossover with Moving Average 50
Type : Bullish
Timeframe : Daily
Bullish price crossover with adaptative moving average 20
Type : Bullish
Timeframe : Daily
The probability of a further increase are moderate given the direction of the technical indicators.
But beware of excesses. The Central Indicators scanner currently detects this:
CCI indicator is overbought : over 100
Type : Neutral
Timeframe : Daily
Pivot points : price is over resistance 1
Type : Neutral
Timeframe : Weekly
Pivot points : price is over resistance 3
Type : Neutral
Timeframe : Daily
RSI indicator is back over 50
Type : Bullish
Timeframe : Daily
Ichimoku : price is over the cloud
Type : Bullish
Timeframe : Daily
Ichimoku - Bearish crossover : Tenkan & Kijun
Type : Bearish
Timeframe : Daily
Williams %R indicator is back over -50
Type : Bullish
Timeframe : Daily
Central Patterns, the market scanner focusing on chart patterns, resistances and supports found these results:
Near horizontal resistance
Type : Bearish
Timeframe : Daily
Near resistance of channel
Type : Bearish
Timeframe : Daily
Central Candlesticks, the scanner specialised in Japanese candlesticks, detects a bullish signal that could support the hypothesis of a small rebound in the very short term:
Upside gap
Type : Bullish
Timeframe : Daily
| S3 | S2 | S1 | Price | R1 | R2 | R3 | |
|---|---|---|---|---|---|---|---|
| ProTrendLines | 0.117 | 0.371 | 0.404 | 0.418 | 0.422 | 0.458 | 0.480 |
| Change (%) | -72.01% | -11.24% | -3.35% | - | +0.96% | +9.57% | +14.83% |
| Change | -0.301 | -0.047 | -0.014 | - | +0.004 | +0.040 | +0.062 |
| Level | Minor | Major | Intermediate | - | Minor | Intermediate | Major |
To determine price objectives, it is also possible to use the pivot points. Here is the price position in relation to pivot points:
| Pivot points | S3 | S2 | S1 | PP | R1 | R2 | R3 |
|---|---|---|---|---|---|---|---|
| Standard | 0.390 | 0.391 | 0.393 | 0.394 | 0.396 | 0.397 | 0.399 |
| Camarilla | 0.394 | 0.395 | 0.395 | 0.395 | 0.395 | 0.396 | 0.396 |
| Woodie | 0.391 | 0.391 | 0.394 | 0.394 | 0.397 | 0.397 | 0.400 |
| Fibonacci | 0.391 | 0.392 | 0.393 | 0.394 | 0.395 | 0.396 | 0.397 |
| Pivot points | S3 | S2 | S1 | PP | R1 | R2 | R3 |
|---|---|---|---|---|---|---|---|
| Standard | 0.337 | 0.352 | 0.371 | 0.386 | 0.405 | 0.420 | 0.439 |
| Camarilla | 0.382 | 0.385 | 0.388 | 0.391 | 0.394 | 0.397 | 0.400 |
| Woodie | 0.340 | 0.353 | 0.374 | 0.387 | 0.408 | 0.421 | 0.442 |
| Fibonacci | 0.352 | 0.365 | 0.373 | 0.386 | 0.399 | 0.407 | 0.420 |
| Pivot points | S3 | S2 | S1 | PP | R1 | R2 | R3 |
|---|---|---|---|---|---|---|---|
| Standard | 0.292 | 0.330 | 0.352 | 0.390 | 0.412 | 0.450 | 0.472 |
| Camarilla | 0.358 | 0.363 | 0.369 | 0.374 | 0.380 | 0.385 | 0.391 |
| Woodie | 0.284 | 0.326 | 0.344 | 0.386 | 0.404 | 0.446 | 0.464 |
| Fibonacci | 0.330 | 0.353 | 0.367 | 0.390 | 0.413 | 0.427 | 0.450 |
Numerical data
The following is the status of the technical indicators and moving averages at the time of publication of this technical analysis:
| RSI (14): | 55.70 | |
| MACD (12,26,9): | -0.0020 | |
| Directional Movement: | -1.051 | |
| AROON (14): | 14.285 | |
| DEMA (21): | 0.396 | |
| Parabolic SAR (0,02-0,02-0,2): | 0.433 | |
| Elder Ray (13): | 0.010 | |
| Super Trend (3,10): | 0.361 | |
| Zig ZAG (10): | 0.418 | |
| VORTEX (21): | 0.8550 | |
| Stochastique (14,3,5): | 51.28 | |
| TEMA (21): | 0.399 | |
| Williams %R (14): | -28.21 | |
| Chande Momentum Oscillator (20): | 0.030 | |
| Repulse (5,40,3): | 3.5570 | |
| ROCnROLL: | 1 | |
| TRIX (15,9): | -0.1330 | |
| Courbe Coppock: | 2.90 |
| MA7: | 0.396 | |
| MA20: | 0.397 | |
| MA50: | 0.408 | |
| MA100: | 0.423 | |
| MAexp7: | 0.401 | |
| MAexp20: | 0.400 | |
| MAexp50: | 0.408 | |
| MAexp100: | 0.424 | |
| Price / MA7: | +5.56% | |
| Price / MA20: | +5.29% | |
| Price / MA50: | +2.45% | |
| Price / MA100: | -1.18% | |
| Price / MAexp7: | +4.24% | |
| Price / MAexp20: | +4.50% | |
| Price / MAexp50: | +2.45% | |
| Price / MAexp100: | -1.42% |
About author
Online


Add a comment
Comments
0 comments on the analysis ACANTHE DEV. - Daily