| Open: | 149.75 |
| Change: | +0.37 |
| Volume: | 112,438 |
| Low: | 149.10 |
| High: | 150.26 |
| High / Low range: | 1.16 |
| Type: | Stocks |
| Ticker: | ADM |
| ISIN: |
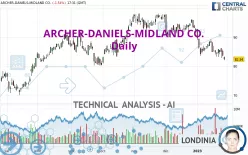
ARCHER-DANIELS-MIDLAND CO. - Daily - Technical analysis published on 01/30/2023 (GMT)
- 243
- 0
- 01/30/2023 - 17:47
Click here for a new analysis!
- Timeframe : Daily
- - Analysis generated on 01/30/2023 - 17:47
- Status : LEVEL MAINTAINED

Summary of the analysis

Additional analysis
Quotes
The ARCHER-DANIELS-MIDLAND CO. price is 82.34 USD. On the day, this instrument lost -1.54% with the lowest point at 82.12 USD and the highest point at 83.33 USD. The deviation from the price is +0.27% for the low point and -1.19% for the high point.The Central Gaps scanner detects the formation of a bearish gap marking the strong presence of sellers ahead of buyers at the opening. This formed a quotation gap.
Opening Gap DOWN
Type : Bearish
Timeframe : Openning
A study of price movements over other periods shows the following variations:
New LOW record (1st january)
Type : Bearish
Timeframe : Weekly
New LOW record (1 month)
Type : Bearish
Timeframe : Weekly
Technical
Technical analysis of this Daily chart of ARCHER-DANIELS-MIDLAND CO. indicates that the overall trend is strongly bearish. 85.71% of the signals given by moving averages are bearish. This strongly bearish trend is supported by the strong bearish signals given by short-term moving averages. The Central Indicators scanner does not detect any result on moving averages that would impact this trend.
The probability of a further decline is moderate given the direction of the technical indicators.
But beware of excesses. The Central Indicators scanner currently detects this:
CCI indicator is oversold : under -100
Type : Neutral
Timeframe : Daily
Williams %R indicator is oversold : under -80
Type : Neutral
Timeframe : Daily
Pivot points : price is under support 1
Type : Neutral
Timeframe : Daily
An analysis of the price chart with the Central Patterns scanner (detector of chart patterns and resistances and supports) shows a result that can have an impact on the price change:
Support of channel is broken
Type : Bearish
Timeframe : Daily
For a small setback in the very short term, the Central Candlesticks scanner currently notes the presence of this bearish pattern in Japanese candlesticks:
Downside gap
Type : Bearish
Timeframe : Daily
| S3 | S2 | S1 | Price | R1 | R2 | R3 | |
|---|---|---|---|---|---|---|---|
| ProTrendLines | 71.06 | 76.91 | 80.11 | 82.34 | 84.25 | 88.44 | 90.83 |
| Change (%) | -13.70% | -6.59% | -2.71% | - | +2.32% | +7.41% | +10.31% |
| Change | -11.28 | -5.43 | -2.23 | - | +1.91 | +6.10 | +8.49 |
| Level | Major | Minor | Intermediate | - | Major | Major | Intermediate |
Pivot points can also be used to set your price objectives. Here is the price situation in relation to pivot points:
| Pivot points | S3 | S2 | S1 | PP | R1 | R2 | R3 |
|---|---|---|---|---|---|---|---|
| Standard | 80.43 | 81.88 | 82.76 | 84.21 | 85.09 | 86.54 | 87.42 |
| Camarilla | 82.99 | 83.20 | 83.42 | 83.63 | 83.84 | 84.06 | 84.27 |
| Woodie | 80.14 | 81.74 | 82.47 | 84.07 | 84.80 | 86.40 | 87.13 |
| Fibonacci | 81.88 | 82.77 | 83.32 | 84.21 | 85.10 | 85.65 | 86.54 |
| Pivot points | S3 | S2 | S1 | PP | R1 | R2 | R3 |
|---|---|---|---|---|---|---|---|
| Standard | 78.76 | 80.78 | 82.21 | 84.23 | 85.66 | 87.68 | 89.11 |
| Camarilla | 82.68 | 83.00 | 83.31 | 83.63 | 83.95 | 84.26 | 84.58 |
| Woodie | 78.46 | 80.63 | 81.91 | 84.08 | 85.36 | 87.53 | 88.81 |
| Fibonacci | 80.78 | 82.10 | 82.92 | 84.23 | 85.55 | 86.37 | 87.68 |
| Pivot points | S3 | S2 | S1 | PP | R1 | R2 | R3 |
|---|---|---|---|---|---|---|---|
| Standard | 81.10 | 85.47 | 89.16 | 93.53 | 97.22 | 101.59 | 105.28 |
| Camarilla | 90.63 | 91.37 | 92.11 | 92.85 | 93.59 | 94.33 | 95.07 |
| Woodie | 80.76 | 85.30 | 88.82 | 93.36 | 96.88 | 101.42 | 104.94 |
| Fibonacci | 85.47 | 88.55 | 90.45 | 93.53 | 96.61 | 98.51 | 101.59 |
Numerical data
The following are the details of the technical indicators and moving averages that were collected to generate this technical analysis:
| RSI (14): | 31.83 | |
| MACD (12,26,9): | -2.0100 | |
| Directional Movement: | -19.39 | |
| AROON (14): | -64.29 | |
| DEMA (21): | 83.86 | |
| Parabolic SAR (0,02-0,02-0,2): | 86.83 | |
| Elder Ray (13): | -2.66 | |
| Super Trend (3,10): | 88.97 | |
| Zig ZAG (10): | 82.40 | |
| VORTEX (21): | 0.7200 | |
| Stochastique (14,3,5): | 15.96 | |
| TEMA (21): | 82.97 | |
| Williams %R (14): | -96.81 | |
| Chande Momentum Oscillator (20): | -4.33 | |
| Repulse (5,40,3): | -2.4200 | |
| ROCnROLL: | 2 | |
| TRIX (15,9): | -0.3100 | |
| Courbe Coppock: | 6.71 |
| MA7: | 84.47 | |
| MA20: | 86.14 | |
| MA50: | 90.85 | |
| MA100: | 89.61 | |
| MAexp7: | 84.35 | |
| MAexp20: | 86.45 | |
| MAexp50: | 88.81 | |
| MAexp100: | 88.67 | |
| Price / MA7: | -2.52% | |
| Price / MA20: | -4.41% | |
| Price / MA50: | -9.37% | |
| Price / MA100: | -8.11% | |
| Price / MAexp7: | -2.38% | |
| Price / MAexp20: | -4.75% | |
| Price / MAexp50: | -7.29% | |
| Price / MAexp100: | -7.14% |
News
Don't forget to follow the news on ARCHER-DANIELS-MIDLAND CO.. At the time of publication of this analysis, the latest news was as follows:
- 10/16/2019 - 14:23 On World Food Day, ADM Announces Partnership with Concern Worldwide to Fight Hunger in Ethiopia, Kenya
- 10/10/2019 - 14:00 ADM to Release Third Quarter Financial Results Oct. 31, 2019
- 10/04/2019 - 20:42 ADM Animal Nutrition Recalls MoorMan’s® ShowTec® Lamb Creep DC
- 10/03/2019 - 18:51 ADM Milling Statement Regarding Flour Recall
- 09/25/2019 - 14:00 ADM Joins Forces with LG Chem to Develop Sustainable Technology for Superabsorbent Polymers Used in Diapers
About author

Online


Add a comment
Comments
0 comments on the analysis ARCHER-DANIELS-MIDLAND CO. - Daily