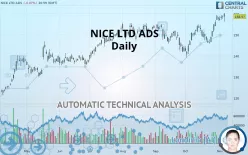
NICE LTD ADS - Daily - Technical analysis published on 11/07/2019 (GMT)
- 362
- 0
- Who voted?
Click here for a new analysis!
- Timeframe : Daily
- - Analysis generated on
- Status : TARGET REACHED

Summary of the analysis

Additional analysis
Quotes
NICE LTD ADS rating 158.57 USD. The price is lower by -0.07% since the last closing with the lowest point at 156.11 USD and the highest point at 160.25 USD. The deviation from the price is +1.58% for the low point and -1.05% for the high point.The Central Gaps scanner detects the formation of a bullish gap marking the strong presence of buyers against sellers at the opening. This formed a quotation gap.
Opening Gap UP
Type : Bullish
Timeframe : Openning
Here is a more detailed summary of the historical variations registered by NICE LTD ADS:
New HIGH record (5 years)
Type : Bullish
Timeframe : Weekly
New HIGH record (1 year)
Type : Bullish
Timeframe : Weekly
New HIGH record (1st january)
Type : Bullish
Timeframe : Weekly
New HIGH record (1 month)
Type : Bullish
Timeframe : Weekly
Technical
A technical analysis in Daily of this NICE LTD ADS chart shows a strongly bullish trend. 92.86% of the signals given by moving averages are bullish. This strongly bullish trend is supported by the strong bullish signals given by short-term moving averages. The Central Indicators market scanner currently does not detect any result that concerns moving averages.
In fact, 13 technical indicators on 18 studied are currently bullish. Caution: the Central Indicators scanner currently detects an excess:
CCI indicator is overbought : over 100
Type : Neutral
Timeframe : Daily
Williams %R indicator is overbought : over -20
Type : Neutral
Timeframe : Daily
Price is back over the pivot point
Type : Bullish
Timeframe : Weekly
Central Patterns, the market scanner focusing on chart patterns, resistances and supports found these results:
Near resistance of channel
Type : Bearish
Timeframe : Daily
Horizontal resistance is broken
Type : Bullish
Timeframe : Daily
No result was found by the Central Candlesticks scanner on Japanese candlesticks.
| S3 | S2 | S1 | Price | R1 | |
|---|---|---|---|---|---|
| ProTrendLines | 135.97 | 146.26 | 154.33 | 158.57 | 158.90 |
| Change (%) | -14.25% | -7.76% | -2.67% | - | +0.21% |
| Change | -22.60 | -12.31 | -4.24 | - | +0.33 |
| Level | Minor | Intermediate | Major | - | Major |
To determine price objectives, it is also possible to use the pivot points. Here is the price position in relation to pivot points:
| Pivot points | S3 | S2 | S1 | PP | R1 | R2 | R3 |
|---|---|---|---|---|---|---|---|
| Standard | 156.09 | 156.77 | 157.73 | 158.41 | 159.36 | 160.04 | 161.00 |
| Camarilla | 158.23 | 158.38 | 158.53 | 158.68 | 158.83 | 158.98 | 159.13 |
| Woodie | 156.23 | 156.84 | 157.86 | 158.47 | 159.50 | 160.11 | 161.13 |
| Fibonacci | 156.77 | 157.40 | 157.78 | 158.41 | 159.03 | 159.42 | 160.04 |
| Pivot points | S3 | S2 | S1 | PP | R1 | R2 | R3 |
|---|---|---|---|---|---|---|---|
| Standard | 144.35 | 147.80 | 152.39 | 155.84 | 160.43 | 163.88 | 168.47 |
| Camarilla | 154.76 | 155.50 | 156.23 | 156.97 | 157.71 | 158.44 | 159.18 |
| Woodie | 144.91 | 148.09 | 152.95 | 156.13 | 160.99 | 164.17 | 169.03 |
| Fibonacci | 147.80 | 150.88 | 152.77 | 155.84 | 158.92 | 160.81 | 163.88 |
| Pivot points | S3 | S2 | S1 | PP | R1 | R2 | R3 |
|---|---|---|---|---|---|---|---|
| Standard | 124.56 | 131.81 | 144.80 | 152.05 | 165.04 | 172.29 | 185.28 |
| Camarilla | 152.22 | 154.08 | 155.94 | 157.79 | 159.65 | 161.50 | 163.36 |
| Woodie | 127.43 | 133.25 | 147.67 | 153.49 | 167.91 | 173.73 | 188.15 |
| Fibonacci | 131.81 | 139.54 | 144.32 | 152.05 | 159.78 | 164.56 | 172.29 |
Numerical data
The following is the status of the technical indicators and moving averages at the time of publication of this technical analysis:
| RSI (14): | 65.52 | |
| MACD (12,26,9): | 2.5300 | |
| Directional Movement: | 12.04 | |
| AROON (14): | 71.43 | |
| DEMA (21): | 156.76 | |
| Parabolic SAR (0,02-0,02-0,2): | 150.14 | |
| Elder Ray (13): | 2.86 | |
| Super Trend (3,10): | 150.41 | |
| Zig ZAG (10): | 158.57 | |
| VORTEX (21): | 1.0800 | |
| Stochastique (14,3,5): | 92.38 | |
| TEMA (21): | 158.72 | |
| Williams %R (14): | -11.52 | |
| Chande Momentum Oscillator (20): | 10.76 | |
| Repulse (5,40,3): | 0.5800 | |
| ROCnROLL: | 1 | |
| TRIX (15,9): | 0.1600 | |
| Courbe Coppock: | 9.21 |
| MA7: | 157.89 | |
| MA20: | 153.14 | |
| MA50: | 150.63 | |
| MA100: | 148.91 | |
| MAexp7: | 157.18 | |
| MAexp20: | 153.88 | |
| MAexp50: | 151.20 | |
| MAexp100: | 147.37 | |
| Price / MA7: | +0.43% | |
| Price / MA20: | +3.55% | |
| Price / MA50: | +5.27% | |
| Price / MA100: | +6.49% | |
| Price / MAexp7: | +0.88% | |
| Price / MAexp20: | +3.05% | |
| Price / MAexp50: | +4.87% | |
| Price / MAexp100: | +7.60% |
News
The last news published on NICE LTD ADS at the time of the generation of this analysis was as follows:
- NICE Actimize Hosts ENGAGE 2019, the Industry’s Premier Event for Innovative Leaders of the Financial Crime and Compliance Industry
- Au10Tix, Daon, and Kingland Join NICE Actimize’s X-Sight Marketplace, the Industry’s First Financial Crime Management Ecosystem
- NICE inContact Achieves Highest and Furthest Overall Position for Ability to Execute and Completeness of Vision, Respectively, in Gartner Magic Quadrant for Contact Center as a Service, North America
- Independent Research Firm Finds High Interest in Adopting AI Across the Contact Center
- NICE Awarded Initiative to Modernize Incident Debriefing Systems for Air Traffic Control the Netherlands
About author

Online


Add a comment
Comments
0 comments on the analysis NICE LTD ADS - Daily