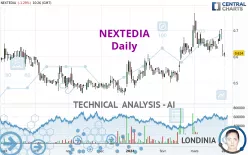
NEXTEDIA - Daily - Technical analysis published on 04/02/2024 (GMT)
- 123
- 0
- Timeframe : Daily
- - Analysis generated on
- Status : NEUTRAL

Summary of the analysis

Additional analysis
Quotes
The NEXTEDIA rating is 0.614 EUR. The price registered a decrease of -1.29% on the session and was traded between 0.600 EUR and 0.618 EUR over the period. The price is currently at +2.33% from its lowest and -0.65% from its highest.Here is a more detailed summary of the historical variations registered by NEXTEDIA:
New LOW record (1 month)
Type : Bearish
Timeframe : Weekly
The Central Volumes scanner detects abnormal volumes on the asset:
Abnormal volumes
Timeframe : 5 days
Abnormal volumes
Timeframe : 20 days
Abnormal volumes
Timeframe : 50 days
Technical
Technical analysis of NEXTEDIA in Daily shows an overall slightly bullish trend. 60.71% of the signals given by moving averages are bullish. Caution: the slightly bearish signals currently given by short-term moving averages indicate that the overall trend could be reversed. The Central Indicators market scanner is currently detecting several bearish signals that could impact this trend:
Bearish trend reversal : Moving Average 20
Type : Bearish
Timeframe : Daily
Bearish trend reversal : adaptative moving average 20
Type : Bearish
Timeframe : Daily
In fact, of the 18 technical indicators analysed by Central Analyzer, 5 are bullish, 8 are neutral and 5 are bearish. Caution: the Central Indicators scanner currently detects an excess:
CCI indicator is oversold : under -100
Type : Neutral
Timeframe : Daily
Williams %R indicator is oversold : under -80
Type : Neutral
Timeframe : Daily
An analysis of the price chart with the Central Patterns scanner (detector of chart patterns and resistances and supports) shows a result that can have an impact on the price change:
Near support of channel
Type : Bullish
Timeframe : Daily
The Central Candlesticks scanner, specialised in Japanese candlesticks, did not identify any signals.
| S3 | S2 | S1 | Price | R1 | R2 | R3 | |
|---|---|---|---|---|---|---|---|
| ProTrendLines | 0.510 | 0.558 | 0.593 | 0.614 | 0.637 | 0.668 | 0.718 |
| Change (%) | -16.94% | -9.12% | -3.42% | - | +3.75% | +8.79% | +16.94% |
| Change | -0.104 | -0.056 | -0.021 | - | +0.023 | +0.054 | +0.104 |
| Level | Major | Minor | Intermediate | - | Major | Intermediate | Major |
Attention could also be paid to pivot points to set price objectives:
| Pivot points | S3 | S2 | S1 | PP | R1 | R2 | R3 |
|---|---|---|---|---|---|---|---|
| Standard | 0.554 | 0.578 | 0.600 | 0.624 | 0.646 | 0.670 | 0.692 |
| Camarilla | 0.609 | 0.614 | 0.618 | 0.622 | 0.626 | 0.630 | 0.635 |
| Woodie | 0.553 | 0.578 | 0.599 | 0.624 | 0.645 | 0.670 | 0.691 |
| Fibonacci | 0.578 | 0.596 | 0.606 | 0.624 | 0.642 | 0.652 | 0.670 |
| Pivot points | S3 | S2 | S1 | PP | R1 | R2 | R3 |
|---|---|---|---|---|---|---|---|
| Standard | 0.479 | 0.541 | 0.581 | 0.643 | 0.683 | 0.745 | 0.785 |
| Camarilla | 0.594 | 0.603 | 0.613 | 0.622 | 0.631 | 0.641 | 0.650 |
| Woodie | 0.469 | 0.536 | 0.571 | 0.638 | 0.673 | 0.740 | 0.775 |
| Fibonacci | 0.541 | 0.580 | 0.604 | 0.643 | 0.682 | 0.706 | 0.745 |
| Pivot points | S3 | S2 | S1 | PP | R1 | R2 | R3 |
|---|---|---|---|---|---|---|---|
| Standard | 0.397 | 0.499 | 0.561 | 0.663 | 0.725 | 0.827 | 0.889 |
| Camarilla | 0.577 | 0.592 | 0.607 | 0.622 | 0.637 | 0.652 | 0.667 |
| Woodie | 0.376 | 0.489 | 0.540 | 0.653 | 0.704 | 0.817 | 0.868 |
| Fibonacci | 0.499 | 0.562 | 0.601 | 0.663 | 0.726 | 0.765 | 0.827 |
Numerical data
The following are the details of the technical indicators and moving averages that were collected to generate this technical analysis:
| RSI (14): | 45.19 | |
| MACD (12,26,9): | 0.0090 | |
| Directional Movement: | 0.088 | |
| AROON (14): | -14.286 | |
| DEMA (21): | 0.660 | |
| Parabolic SAR (0,02-0,02-0,2): | 0.704 | |
| Elder Ray (13): | -0.039 | |
| Super Trend (3,10): | 0.594 | |
| Zig ZAG (10): | 0.614 | |
| VORTEX (21): | 0.9130 | |
| Stochastique (14,3,5): | 43.60 | |
| TEMA (21): | 0.650 | |
| Williams %R (14): | -86.54 | |
| Chande Momentum Oscillator (20): | -0.036 | |
| Repulse (5,40,3): | 3.7870 | |
| ROCnROLL: | -1 | |
| TRIX (15,9): | 0.3490 | |
| Courbe Coppock: | 2.77 |
| MA7: | 0.651 | |
| MA20: | 0.652 | |
| MA50: | 0.606 | |
| MA100: | 0.557 | |
| MAexp7: | 0.646 | |
| MAexp20: | 0.644 | |
| MAexp50: | 0.615 | |
| MAexp100: | 0.590 | |
| Price / MA7: | -5.68% | |
| Price / MA20: | -5.83% | |
| Price / MA50: | +1.32% | |
| Price / MA100: | +10.23% | |
| Price / MAexp7: | -4.95% | |
| Price / MAexp20: | -4.66% | |
| Price / MAexp50: | -0.16% | |
| Price / MAexp100: | +4.07% |
About author

Online


Add a comment
Comments
0 comments on the analysis NEXTEDIA - Daily