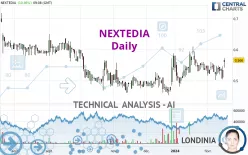
NEXTEDIA - Daily - Technical analysis published on 02/16/2024 (GMT)
- 140
- 0
Click here for a new analysis!
- Timeframe : Daily
- - Analysis generated on
- Status : TARGET REACHED

Summary of the analysis

Additional analysis
Quotes
The NEXTEDIA rating is 0.566 EUR. The price has increased by +10.98% since the last closing and was traded between 0.542 EUR and 0.572 EUR over the period. The price is currently at +4.43% from its lowest and -1.05% from its highest.The Central Gaps scanner detects the formation of a bullish gap marking the strong presence of buyers against sellers at the opening. This formed a quotation gap.
Opening Gap UP
Type : Bullish
Timeframe : Openning
Here is a more detailed summary of the historical variations registered by NEXTEDIA:
Abnormal volumes
Timeframe : 5 days
Abnormal volumes
Timeframe : 50 days
Technical
A technical analysis in Daily of this NEXTEDIA chart shows a bullish trend. The signals returned by the moving averages are 75.00% bullish. This bullish trend is reinforced by the strong signals currently being given by short-term moving averages. An assessment of moving averages reveals several bullish signals that could impact this trend:
Bullish price crossover with Moving Average 20
Type : Bullish
Timeframe : Daily
Bullish price crossover with Moving Average 50
Type : Bullish
Timeframe : Daily
Bullish price crossover with Moving Average 100
Type : Bullish
Timeframe : Daily
Bullish price crossover with adaptative moving average 20
Type : Bullish
Timeframe : Daily
Bullish price crossover with adaptative moving average 50
Type : Bullish
Timeframe : Daily
Bullish price crossover with adaptative moving average 100
Type : Bullish
Timeframe : Daily
The technical indicators are bullish. There is still some doubt about the price increase.
But beware of excesses. The Central Indicators scanner currently detects this:
CCI indicator is overbought : over 100
Type : Neutral
Timeframe : Daily
Previous candle closed under Bollinger bands
Type : Neutral
Timeframe : Daily
CCI indicator: bullish divergence
Type : Bullish
Timeframe : Daily
Williams %R indicator is overbought : over -20
Type : Neutral
Timeframe : Daily
Pivot points : price is over resistance 1
Type : Neutral
Timeframe : Daily
RSI indicator is back over 50
Type : Bullish
Timeframe : Daily
Parabolic SAR indicator bullish reversal
Type : Bullish
Timeframe : Daily
Aroon indicator bullish trend
Type : Bullish
Timeframe : Daily
Ichimoku : price is over the cloud
Type : Bullish
Timeframe : Daily
MACD indicator is back over 0
Type : Bullish
Timeframe : Daily
Momentum indicator is back over 0
Type : Bullish
Timeframe : Daily
An analysis of the price chart with the Central Patterns scanner (detector of chart patterns and resistances and supports) shows several results that can have an impact on the price change:
Near resistance of triangle
Type : Bearish
Timeframe : Daily
Horizontal resistance is broken
Type : Bullish
Timeframe : Daily
Resistance of channel is broken
Type : Bullish
Timeframe : Daily
There is also a Japanese candlestick pattern detected by Central Candlesticks that could mark the end of the current short-term trend:
Doji
Type : Neutral
Timeframe : Daily
| S3 | S2 | S1 | Price | R1 | R2 | R3 | |
|---|---|---|---|---|---|---|---|
| ProTrendLines | 0.465 | 0.488 | 0.524 | 0.566 | 0.635 | 0.697 | 0.748 |
| Change (%) | -17.84% | -13.78% | -7.42% | - | +12.19% | +23.14% | +32.16% |
| Change | -0.101 | -0.078 | -0.042 | - | +0.069 | +0.131 | +0.182 |
| Level | Intermediate | Intermediate | Minor | - | Intermediate | Minor | Intermediate |
Attention could also be paid to pivot points to set price objectives:
| Pivot points | S3 | S2 | S1 | PP | R1 | R2 | R3 |
|---|---|---|---|---|---|---|---|
| Standard | 0.452 | 0.478 | 0.494 | 0.520 | 0.536 | 0.562 | 0.578 |
| Camarilla | 0.499 | 0.502 | 0.506 | 0.510 | 0.514 | 0.518 | 0.522 |
| Woodie | 0.447 | 0.476 | 0.489 | 0.518 | 0.531 | 0.560 | 0.573 |
| Fibonacci | 0.478 | 0.494 | 0.504 | 0.520 | 0.536 | 0.546 | 0.562 |
| Pivot points | S3 | S2 | S1 | PP | R1 | R2 | R3 |
|---|---|---|---|---|---|---|---|
| Standard | 0.451 | 0.477 | 0.509 | 0.535 | 0.567 | 0.593 | 0.625 |
| Camarilla | 0.526 | 0.531 | 0.537 | 0.542 | 0.547 | 0.553 | 0.558 |
| Woodie | 0.455 | 0.479 | 0.513 | 0.537 | 0.571 | 0.595 | 0.629 |
| Fibonacci | 0.477 | 0.499 | 0.513 | 0.535 | 0.557 | 0.571 | 0.593 |
| Pivot points | S3 | S2 | S1 | PP | R1 | R2 | R3 |
|---|---|---|---|---|---|---|---|
| Standard | 0.347 | 0.413 | 0.477 | 0.543 | 0.607 | 0.673 | 0.737 |
| Camarilla | 0.504 | 0.516 | 0.528 | 0.540 | 0.552 | 0.564 | 0.576 |
| Woodie | 0.345 | 0.413 | 0.475 | 0.543 | 0.605 | 0.673 | 0.735 |
| Fibonacci | 0.413 | 0.463 | 0.494 | 0.543 | 0.593 | 0.624 | 0.673 |
Numerical data
The following are the details of the technical indicators and moving averages that were collected to generate this technical analysis:
| RSI (14): | 55.89 | |
| MACD (12,26,9): | 0.0010 | |
| Directional Movement: | 4.816 | |
| AROON (14): | 42.857 | |
| DEMA (21): | 0.540 | |
| Parabolic SAR (0,02-0,02-0,2): | 0.502 | |
| Elder Ray (13): | 0.020 | |
| Super Trend (3,10): | 0.492 | |
| Zig ZAG (10): | 0.560 | |
| VORTEX (21): | 0.8640 | |
| Stochastique (14,3,5): | 56.72 | |
| TEMA (21): | 0.538 | |
| Williams %R (14): | -20.00 | |
| Chande Momentum Oscillator (20): | 0.028 | |
| Repulse (5,40,3): | 1.0500 | |
| ROCnROLL: | 1 | |
| TRIX (15,9): | 0.0670 | |
| Courbe Coppock: | 4.07 |
| MA7: | 0.536 | |
| MA20: | 0.540 | |
| MA50: | 0.526 | |
| MA100: | 0.520 | |
| MAexp7: | 0.539 | |
| MAexp20: | 0.538 | |
| MAexp50: | 0.532 | |
| MAexp100: | 0.540 | |
| Price / MA7: | +5.60% | |
| Price / MA20: | +4.81% | |
| Price / MA50: | +7.60% | |
| Price / MA100: | +8.85% | |
| Price / MAexp7: | +5.01% | |
| Price / MAexp20: | +5.20% | |
| Price / MAexp50: | +6.39% | |
| Price / MAexp100: | +4.81% |
About author
Online


Add a comment
Comments
0 comments on the analysis NEXTEDIA - Daily