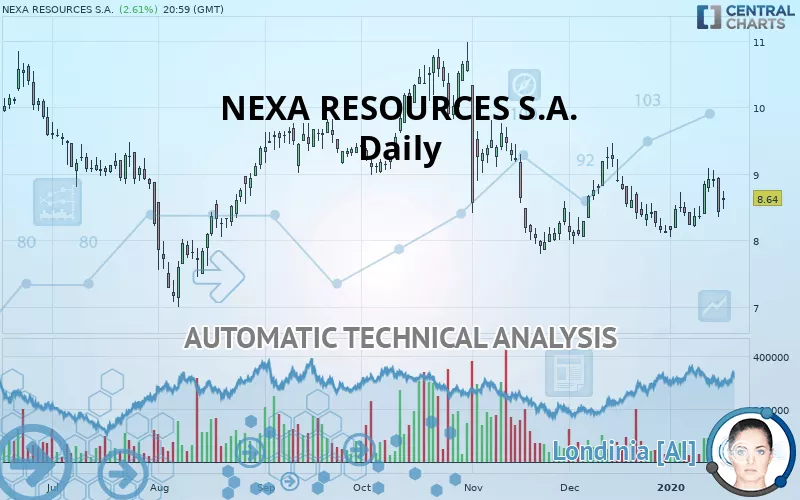
NEXA RESOURCES S.A. - Daily - Technical analysis published on 01/20/2020 (GMT)
- 298
- 0
Click here for a new analysis!
- Timeframe : Daily
- - Analysis generated on
- Status : TARGET REACHED

Summary of the analysis

Additional analysis
Quotes
NEXA RESOURCES S.A. rating 8.64 USD. The price has increased by +2.61% since the last closing with the lowest point at 8.47 USD and the highest point at 8.74 USD. The deviation from the price is +2.01% for the low point and -1.14% for the high point.A bullish opening was detected by the Central Gaps scanner. Buyers are trying to impose a bullish momentum in the very short term.
Bullish opening
Type : Bullish
Timeframe : Openning
Here is a more detailed summary of the historical variations registered by NEXA RESOURCES S.A.:
Technical
A technical analysis in Daily of this NEXA RESOURCES S.A. chart shows a bearish trend. The signals given by moving averages are at 67.86% bearish. This bearish trend could slow down given the slightly bullish signals currently being given by short-term moving averages. The Central Indicators market scanner is currently detecting several bearish signals that could impact this trend:
Bearish trend reversal : Moving Average 100
Type : Bearish
Timeframe : Daily
Bearish trend reversal : adaptative moving average 50
Type : Bearish
Timeframe : Daily
Bearish price crossover with Moving Average 20
Type : Bearish
Timeframe : Daily
Bearish price crossover with Moving Average 50
Type : Bearish
Timeframe : Daily
Bearish price crossover with adaptative moving average 20
Type : Bearish
Timeframe : Daily
In fact, according to the parameters integrated into the Central Analyzer system, 11 technical indicators out of 18 analysed are currently bullish. Caution: the Central Indicators scanner currently detects an excess:
Previous candle closed over Bollinger bands
Type : Neutral
Timeframe : Daily
Williams %R indicator is overbought : over -20
Type : Neutral
Timeframe : Daily
RSI indicator is back under 50
Type : Bearish
Timeframe : Daily
Ichimoku : price is under the cloud
Type : Bearish
Timeframe : Daily
MACD indicator is back under 0
Type : Bearish
Timeframe : Daily
Price is back under the pivot point
Type : Bearish
Timeframe : Daily
Price is back under the pivot point
Type : Bearish
Timeframe : Weekly
Williams %R indicator is back under -50
Type : Bearish
Timeframe : Daily
No signals are given by Central Patterns, a market scanner specialised in chart patterns, resistances and supports.
Central Candlesticks, the scanner specialised in Japanese candlesticks, detects a bearish signal that could support the hypothesis of a small drop in the very short term:
Bearish engulfing lines
Type : Bearish
Timeframe : Daily
| S3 | S2 | S1 | Price | R1 | R2 | R3 | |
|---|---|---|---|---|---|---|---|
| ProTrendLines | 7.17 | 7.91 | 8.54 | 8.64 | 9.25 | 9.97 | 10.79 |
| Change (%) | -17.01% | -8.45% | -1.16% | - | +7.06% | +15.39% | +24.88% |
| Change | -1.47 | -0.73 | -0.10 | - | +0.61 | +1.33 | +2.15 |
| Level | Intermediate | Major | Major | - | Intermediate | Minor | Major |
Attention could also be paid to pivot points to set price objectives:
| Pivot points | S3 | S2 | S1 | PP | R1 | R2 | R3 |
|---|---|---|---|---|---|---|---|
| Standard | 7.60 | 7.97 | 8.20 | 8.57 | 8.80 | 9.17 | 9.40 |
| Camarilla | 8.26 | 8.31 | 8.37 | 8.42 | 8.48 | 8.53 | 8.59 |
| Woodie | 7.52 | 7.94 | 8.12 | 8.54 | 8.72 | 9.14 | 9.32 |
| Fibonacci | 7.97 | 8.20 | 8.34 | 8.57 | 8.80 | 8.94 | 9.17 |
| Pivot points | S3 | S2 | S1 | PP | R1 | R2 | R3 |
|---|---|---|---|---|---|---|---|
| Standard | 7.62 | 7.91 | 8.13 | 8.43 | 8.65 | 8.94 | 9.16 |
| Camarilla | 8.21 | 8.26 | 8.30 | 8.35 | 8.40 | 8.44 | 8.49 |
| Woodie | 7.58 | 7.89 | 8.09 | 8.41 | 8.61 | 8.92 | 9.12 |
| Fibonacci | 7.91 | 8.11 | 8.23 | 8.43 | 8.62 | 8.74 | 8.94 |
| Pivot points | S3 | S2 | S1 | PP | R1 | R2 | R3 |
|---|---|---|---|---|---|---|---|
| Standard | 6.05 | 6.99 | 7.57 | 8.51 | 9.09 | 10.03 | 10.61 |
| Camarilla | 7.72 | 7.86 | 8.00 | 8.14 | 8.28 | 8.42 | 8.56 |
| Woodie | 5.86 | 6.90 | 7.38 | 8.42 | 8.90 | 9.94 | 10.42 |
| Fibonacci | 6.99 | 7.57 | 7.93 | 8.51 | 9.09 | 9.45 | 10.03 |
Numerical data
The following is the status of the technical indicators and moving averages at the time of publication of this technical analysis:
| RSI (14): | 51.71 | |
| MACD (12,26,9): | 0.0100 | |
| Directional Movement: | 0.62 | |
| AROON (14): | 57.14 | |
| DEMA (21): | 8.52 | |
| Parabolic SAR (0,02-0,02-0,2): | 8.18 | |
| Elder Ray (13): | 0.05 | |
| Super Trend (3,10): | 8.93 | |
| Zig ZAG (10): | 8.64 | |
| VORTEX (21): | 0.9400 | |
| Stochastique (14,3,5): | 58.65 | |
| TEMA (21): | 8.64 | |
| Williams %R (14): | -43.27 | |
| Chande Momentum Oscillator (20): | 0.50 | |
| Repulse (5,40,3): | -2.8800 | |
| ROCnROLL: | -1 | |
| TRIX (15,9): | -0.0800 | |
| Courbe Coppock: | 6.47 |
| MA7: | 8.64 | |
| MA20: | 8.45 | |
| MA50: | 8.59 | |
| MA100: | 9.13 | |
| MAexp7: | 8.62 | |
| MAexp20: | 8.55 | |
| MAexp50: | 8.69 | |
| MAexp100: | 8.94 | |
| Price / MA7: | -0% | |
| Price / MA20: | +2.25% | |
| Price / MA50: | +0.58% | |
| Price / MA100: | -5.37% | |
| Price / MAexp7: | +0.23% | |
| Price / MAexp20: | +1.05% | |
| Price / MAexp50: | -0.58% | |
| Price / MAexp100: | -3.36% |
About author

Online


Add a comment
Comments
0 comments on the analysis NEXA RESOURCES S.A. - Daily