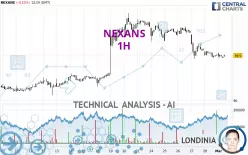
NEXANS - 1H - Technical analysis published on 03/03/2025 (GMT)
- 36
- 0
Click here for a new analysis!
- Timeframe : 1H
- - Analysis generated on
- Status : TARGET REACHED

Summary of the analysis

Additional analysis
Quotes
NEXANS rating 99.90 EUR. On the day, this instrument lost -0.10% with the lowest point at 99.35 EUR and the highest point at 100.50 EUR. The deviation from the price is +0.55% for the low point and -0.60% for the high point.A bullish opening was detected by the Central Gaps scanner. Buyers are trying to impose a bullish momentum in the very short term.
Bullish opening
Type : Bullish
Timeframe : Openning
Here is a more detailed summary of the historical variations registered by NEXANS:
Technical
A technical analysis in 1H of this NEXANS chart shows a bearish trend. 71.43% of the signals given by moving averages are bearish. The overall trend seems to be showing some signs of weakness, as do the tentative bearish signals from short-term moving averages. There is no crossing of moving average by the price or crossing of moving averages between themselves.
The technical indicators are generally neutral. They do not provide relevant information on the direction of future price movements.
Caution: the Central Indicators scanner currently detects an excess:
CCI indicator is oversold : under -100
Type : Neutral
Timeframe : 1 hour
RSI indicator: bullish divergence
Type : Bullish
Timeframe : 1 hour
Williams %R indicator is oversold : under -80
Type : Neutral
Timeframe : 1 hour
An analysis of the price chart with the Central Patterns scanner (detector of chart patterns and resistances and supports) shows several results that can have an impact on the price change:
Near horizontal support
Type : Bullish
Timeframe : 1 hour
Near support of channel
Type : Bullish
Timeframe : 1 hour
There is also a Japanese candlestick pattern detected by Central Candlesticks that could mark the end of the current short-term trend:
Doji
Type : Neutral
Timeframe : 1 hour
| S3 | S2 | S1 | Price | R1 | R2 | R3 | |
|---|---|---|---|---|---|---|---|
| ProTrendLines | 93.12 | 96.55 | 99.15 | 99.90 | 101.30 | 103.10 | 105.70 |
| Change (%) | -6.79% | -3.35% | -0.75% | - | +1.40% | +3.20% | +5.81% |
| Change | -6.78 | -3.35 | -0.75 | - | +1.40 | +3.20 | +5.80 |
| Level | Intermediate | Major | Minor | - | Minor | Minor | Intermediate |
Attention could also be paid to pivot points to set price objectives:
| Pivot points | S3 | S2 | S1 | PP | R1 | R2 | R3 |
|---|---|---|---|---|---|---|---|
| Standard | 97.72 | 98.53 | 99.27 | 100.08 | 100.82 | 101.63 | 102.37 |
| Camarilla | 99.57 | 99.72 | 99.86 | 100.00 | 100.14 | 100.28 | 100.43 |
| Woodie | 97.68 | 98.51 | 99.23 | 100.06 | 100.78 | 101.61 | 102.33 |
| Fibonacci | 98.53 | 99.13 | 99.49 | 100.08 | 100.68 | 101.04 | 101.63 |
| Pivot points | S3 | S2 | S1 | PP | R1 | R2 | R3 |
|---|---|---|---|---|---|---|---|
| Standard | 89.38 | 94.27 | 97.13 | 102.02 | 104.88 | 109.77 | 112.63 |
| Camarilla | 97.87 | 98.58 | 99.29 | 100.00 | 100.71 | 101.42 | 102.13 |
| Woodie | 88.38 | 93.76 | 96.13 | 101.51 | 103.88 | 109.26 | 111.63 |
| Fibonacci | 94.27 | 97.23 | 99.06 | 102.02 | 104.98 | 106.81 | 109.77 |
| Pivot points | S3 | S2 | S1 | PP | R1 | R2 | R3 |
|---|---|---|---|---|---|---|---|
| Standard | 68.35 | 78.40 | 89.20 | 99.25 | 110.05 | 120.10 | 130.90 |
| Camarilla | 94.27 | 96.18 | 98.09 | 100.00 | 101.91 | 103.82 | 105.73 |
| Woodie | 68.73 | 78.59 | 89.58 | 99.44 | 110.43 | 120.29 | 131.28 |
| Fibonacci | 78.40 | 86.37 | 91.29 | 99.25 | 107.22 | 112.14 | 120.10 |
Numerical data
The following is the status of the technical indicators and moving averages at the time of publication of this technical analysis:
| RSI (14): | 38.04 | |
| MACD (12,26,9): | -0.9700 | |
| Directional Movement: | -20.44 | |
| AROON (14): | -50.00 | |
| DEMA (21): | 99.37 | |
| Parabolic SAR (0,02-0,02-0,2): | 101.13 | |
| Elder Ray (13): | -0.37 | |
| Super Trend (3,10): | 101.62 | |
| Zig ZAG (10): | 100.00 | |
| VORTEX (21): | 0.9400 | |
| Stochastique (14,3,5): | 24.06 | |
| TEMA (21): | 99.17 | |
| Williams %R (14): | -58.06 | |
| Chande Momentum Oscillator (20): | -0.80 | |
| Repulse (5,40,3): | 0.6100 | |
| ROCnROLL: | 2 | |
| TRIX (15,9): | -0.1600 | |
| Courbe Coppock: | 2.47 |
| MA7: | 102.97 | |
| MA20: | 98.03 | |
| MA50: | 98.29 | |
| MA100: | 108.93 | |
| MAexp7: | 99.95 | |
| MAexp20: | 100.71 | |
| MAexp50: | 101.94 | |
| MAexp100: | 101.29 | |
| Price / MA7: | -2.98% | |
| Price / MA20: | +1.91% | |
| Price / MA50: | +1.64% | |
| Price / MA100: | -8.29% | |
| Price / MAexp7: | -0.05% | |
| Price / MAexp20: | -0.80% | |
| Price / MAexp50: | -2.00% | |
| Price / MAexp100: | -1.37% |
News
The last news published on NEXANS at the time of the generation of this analysis was as follows:
- Disclosure of trading in own shares from February 20, 2025 to February 21, 2025
- Information on share capital and voting rights - January 2025
- Nexans announces a new organization to support a new stage of its development
- Half-year statement on Nexans liquidity contract - July 1st to December 31st, 2024
- Information on share capital and voting rights - December 2024
About author
Online


Add a comment
Comments
0 comments on the analysis NEXANS - 1H