| Open: | 1.48 |
| Change: | 0 |
| Volume: | 0 |
| Low: | 1.48 |
| High: | 1.48 |
| High / Low range: | 0 |
| Type: | Stocks |
| Ticker: | NEX |
| ISIN: | FR0000044448 |
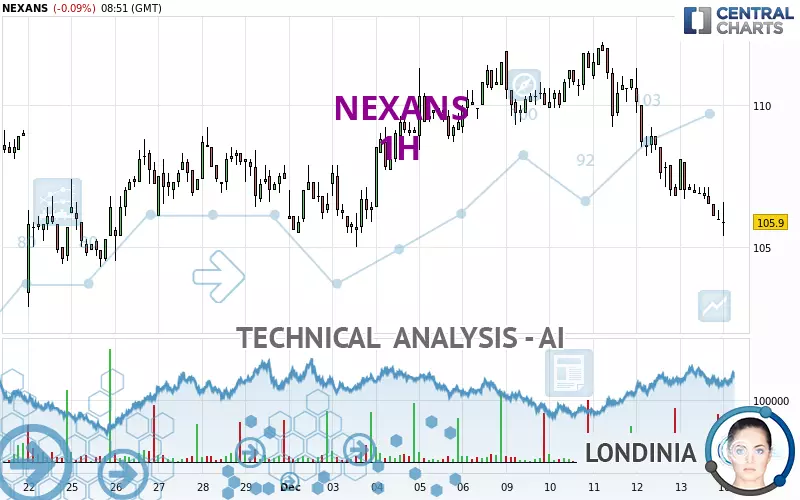
NEXANS - 1H - Technical analysis published on 12/16/2024 (GMT)
- 136
- 0
- 12/16/2024 - 09:10
Click here for a new analysis!
- Timeframe : 1H
- - Analysis generated on 12/16/2024 - 09:10
- Status : LEVEL MAINTAINED

Summary of the analysis

Additional analysis
Quotes
The NEXANS rating is 105.90 EUR. The price registered a decrease of -0.09% on the session and was traded between 105.40 EUR and 106.60 EUR over the period. The price is currently at +0.47% from its lowest and -0.66% from its highest.A bearish gap was detected at the opening by the Central Gaps scanner. There are a lot of sellers and they have the upper hand in the very short term.
Opening Gap DOWN
Type : Bearish
Timeframe : Openning
A study of price movements over other periods shows the following variations:
Near a new LOW record (1 month)
Type : Bearish
Timeframe : Weekly
Technical
A technical analysis in 1H of this NEXANS chart shows a sharp bearish trend. The signals given by moving averages are 89.29% bearish. This strong bearish trend is confirmed by the strong signals currently being given by short-term moving averages. There is no crossing of moving average by the price or crossing of moving averages between themselves.
In fact, according to the parameters integrated into the Central Analyzer system, 11 technical indicators out of 18 analysed are currently bearish. Caution: the Central Indicators scanner currently detects an excess:
RSI indicator is oversold : under 30
Type : Neutral
Timeframe : 1 hour
CCI indicator is oversold : under -100
Type : Neutral
Timeframe : 1 hour
Williams %R indicator is oversold : under -80
Type : Neutral
Timeframe : 1 hour
Central Patterns, the market scanner focusing on chart patterns, resistances and supports found these results:
Near horizontal support
Type : Bullish
Timeframe : 1 hour
Near support of channel
Type : Bullish
Timeframe : 1 hour
No result was found by the Central Candlesticks scanner on Japanese candlesticks.
| S3 | S2 | S1 | Price | R1 | R2 | R3 | |
|---|---|---|---|---|---|---|---|
| ProTrendLines | 101.30 | 102.90 | 105.70 | 105.90 | 109.20 | 112.20 | 114.30 |
| Change (%) | -4.34% | -2.83% | -0.19% | - | +3.12% | +5.95% | +7.93% |
| Change | -4.60 | -3.00 | -0.20 | - | +3.30 | +6.30 | +8.40 |
| Level | Intermediate | Minor | Major | - | Major | Intermediate | Major |
Attention could also be paid to pivot points to set price objectives:
| Pivot points | S3 | S2 | S1 | PP | R1 | R2 | R3 |
|---|---|---|---|---|---|---|---|
| Standard | 103.20 | 104.60 | 105.30 | 106.70 | 107.40 | 108.80 | 109.50 |
| Camarilla | 105.42 | 105.62 | 105.81 | 106.00 | 106.19 | 106.39 | 106.58 |
| Woodie | 102.85 | 104.43 | 104.95 | 106.53 | 107.05 | 108.63 | 109.15 |
| Fibonacci | 104.60 | 105.40 | 105.90 | 106.70 | 107.50 | 108.00 | 108.80 |
| Pivot points | S3 | S2 | S1 | PP | R1 | R2 | R3 |
|---|---|---|---|---|---|---|---|
| Standard | 97.73 | 101.87 | 103.93 | 108.07 | 110.13 | 114.27 | 116.33 |
| Camarilla | 104.30 | 104.86 | 105.43 | 106.00 | 106.57 | 107.14 | 107.71 |
| Woodie | 96.70 | 101.35 | 102.90 | 107.55 | 109.10 | 113.75 | 115.30 |
| Fibonacci | 101.87 | 104.24 | 105.70 | 108.07 | 110.44 | 111.90 | 114.27 |
| Pivot points | S3 | S2 | S1 | PP | R1 | R2 | R3 |
|---|---|---|---|---|---|---|---|
| Standard | 66.30 | 84.60 | 96.00 | 114.30 | 125.70 | 144.00 | 155.40 |
| Camarilla | 99.23 | 101.96 | 104.68 | 107.40 | 110.12 | 112.85 | 115.57 |
| Woodie | 62.85 | 82.88 | 92.55 | 112.58 | 122.25 | 142.28 | 151.95 |
| Fibonacci | 84.60 | 95.95 | 102.96 | 114.30 | 125.65 | 132.66 | 144.00 |
Numerical data
The following is the status of technical indicators and moving averages registered at the time this technical analysis was created:
| RSI (14): | 31.09 | |
| MACD (12,26,9): | -1.0100 | |
| Directional Movement: | -24.91 | |
| AROON (14): | -100.00 | |
| DEMA (21): | 106.25 | |
| Parabolic SAR (0,02-0,02-0,2): | 107.12 | |
| Elder Ray (13): | -0.96 | |
| Super Trend (3,10): | 108.09 | |
| Zig ZAG (10): | 106.00 | |
| VORTEX (21): | 0.6500 | |
| Stochastique (14,3,5): | 6.45 | |
| TEMA (21): | 105.66 | |
| Williams %R (14): | -80.65 | |
| Chande Momentum Oscillator (20): | -1.80 | |
| Repulse (5,40,3): | -0.5000 | |
| ROCnROLL: | 2 | |
| TRIX (15,9): | -0.1200 | |
| Courbe Coppock: | 4.31 |
| MA7: | 108.93 | |
| MA20: | 108.25 | |
| MA50: | 120.55 | |
| MA100: | 121.26 | |
| MAexp7: | 106.44 | |
| MAexp20: | 107.52 | |
| MAexp50: | 108.58 | |
| MAexp100: | 109.05 | |
| Price / MA7: | -2.78% | |
| Price / MA20: | -2.17% | |
| Price / MA50: | -12.15% | |
| Price / MA100: | -12.67% | |
| Price / MAexp7: | -0.51% | |
| Price / MAexp20: | -1.51% | |
| Price / MAexp50: | -2.47% | |
| Price / MAexp100: | -2.89% |
News
Don't forget to follow the news on NEXANS. At the time of publication of this analysis, the latest news was as follows:
- 12/12/2024 - 07:30 Press release
- 12/03/2024 - 11:30 Information on share capital and voting rights - November 2024
- 12/02/2024 - 11:30 Disclosure of trading in own shares from November 25, 2024 to November 29, 2024
- 11/25/2024 - 14:10 Disclosure of trading in own shares from November 18, 2024 to November 21, 2024
- 11/18/2024 - 17:45 Disclosure of trading in own shares from November 12, 2024 to November 14, 2024
About author
Online


Add a comment
Comments
0 comments on the analysis NEXANS - 1H