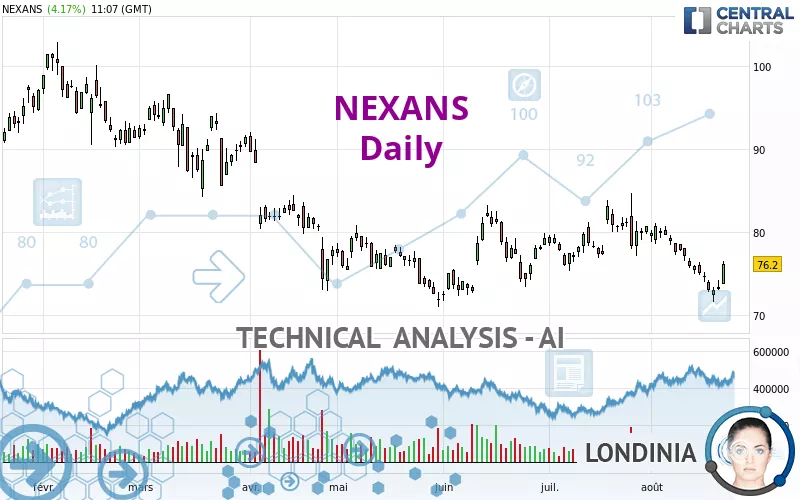
NEXANS - Daily - Technical analysis published on 08/22/2023 (GMT)
- 232
- 0
Click here for a new analysis!
- Timeframe : Daily
- - Analysis generated on
- Status : TARGET REACHED
Summary of the analysis

Additional analysis
Quotes
The NEXANS rating is 76.20 EUR. The price has increased by +4.17% since the last closing with the lowest point at 73.75 EUR and the highest point at 76.55 EUR. The deviation from the price is +3.32% for the low point and -0.46% for the high point.So that you have an overall view of the price change, here is a table showing the variations over several periods:
Near a new LOW record (1 year)
Type : Bearish
Timeframe : Weekly
Near a new LOW record (1st january)
Type : Bearish
Timeframe : Weekly
Near a new LOW record (1 month)
Type : Bearish
Timeframe : Weekly
Technical
A technical analysis in Daily of this NEXANS chart shows a sharp bearish trend. 89.29% of the signals given by moving averages are bearish. The overall trend is supported by the strong bearish signals from short-term moving averages. The Central Indicators scanner does not detect any result on moving averages that would impact this trend.
An assessment of technical indicators does not currently provide any relevant information on the direction of future price movements.
Central Indicators, the detector scanner for these technical indicators has recently detected several signals:
Pivot points : price is over resistance 1
Type : Neutral
Timeframe : Weekly
Pivot points : price is over resistance 3
Type : Neutral
Timeframe : Daily
Williams %R indicator is back over -50
Type : Bullish
Timeframe : Daily
Central Patterns, the scanner specializing in chart patterns, did not identify any signals.
The Central Candlesticks scanner, specialised in Japanese candlesticks, did not identify any signals.
| S3 | S2 | S1 | Price | R1 | R2 | R3 | |
|---|---|---|---|---|---|---|---|
| ProTrendLines | 47.05 | 55.40 | 70.67 | 76.20 | 78.35 | 83.18 | 88.83 |
| Change (%) | -38.25% | -27.30% | -7.26% | - | +2.82% | +9.16% | +16.57% |
| Change | -29.15 | -20.80 | -5.53 | - | +2.15 | +6.98 | +12.63 |
| Level | Minor | Major | Major | - | Major | Intermediate | Major |
Attention could also be paid to pivot points to set price objectives:
| Pivot points | S3 | S2 | S1 | PP | R1 | R2 | R3 |
|---|---|---|---|---|---|---|---|
| Standard | 71.52 | 72.28 | 72.72 | 73.48 | 73.92 | 74.68 | 75.12 |
| Camarilla | 72.82 | 72.93 | 73.04 | 73.15 | 73.26 | 73.37 | 73.48 |
| Woodie | 71.35 | 72.20 | 72.55 | 73.40 | 73.75 | 74.60 | 74.95 |
| Fibonacci | 72.28 | 72.74 | 73.03 | 73.48 | 73.94 | 74.23 | 74.68 |
| Pivot points | S3 | S2 | S1 | PP | R1 | R2 | R3 |
|---|---|---|---|---|---|---|---|
| Standard | 66.05 | 68.80 | 70.95 | 73.70 | 75.85 | 78.60 | 80.75 |
| Camarilla | 71.75 | 72.20 | 72.65 | 73.10 | 73.55 | 74.00 | 74.45 |
| Woodie | 65.75 | 68.65 | 70.65 | 73.55 | 75.55 | 78.45 | 80.45 |
| Fibonacci | 68.80 | 70.67 | 71.83 | 73.70 | 75.57 | 76.73 | 78.60 |
| Pivot points | S3 | S2 | S1 | PP | R1 | R2 | R3 |
|---|---|---|---|---|---|---|---|
| Standard | 66.38 | 70.87 | 75.78 | 80.27 | 85.18 | 89.67 | 94.58 |
| Camarilla | 78.12 | 78.98 | 79.84 | 80.70 | 81.56 | 82.42 | 83.29 |
| Woodie | 66.60 | 70.98 | 76.00 | 80.38 | 85.40 | 89.78 | 94.80 |
| Fibonacci | 70.87 | 74.46 | 76.68 | 80.27 | 83.86 | 86.08 | 89.67 |
Numerical data
The following is the status of the technical indicators and moving averages at the time of publication of this technical analysis:
| RSI (14): | 46.91 | |
| MACD (12,26,9): | -1.2800 | |
| Directional Movement: | -2.04 | |
| AROON (14): | -85.71 | |
| DEMA (21): | 75.15 | |
| Parabolic SAR (0,02-0,02-0,2): | 77.12 | |
| Elder Ray (13): | -0.65 | |
| Super Trend (3,10): | 77.66 | |
| Zig ZAG (10): | 76.20 | |
| VORTEX (21): | 0.7800 | |
| Stochastique (14,3,5): | 27.84 | |
| TEMA (21): | 73.90 | |
| Williams %R (14): | -49.46 | |
| Chande Momentum Oscillator (20): | -3.45 | |
| Repulse (5,40,3): | 3.1500 | |
| ROCnROLL: | -1 | |
| TRIX (15,9): | -0.1500 | |
| Courbe Coppock: | 13.62 |
| MA7: | 74.46 | |
| MA20: | 77.42 | |
| MA50: | 78.17 | |
| MA100: | 77.63 | |
| MAexp7: | 74.88 | |
| MAexp20: | 76.56 | |
| MAexp50: | 77.64 | |
| MAexp100: | 79.18 | |
| Price / MA7: | +2.34% | |
| Price / MA20: | -1.58% | |
| Price / MA50: | -2.52% | |
| Price / MA100: | -1.84% | |
| Price / MAexp7: | +1.76% | |
| Price / MAexp20: | -0.47% | |
| Price / MAexp50: | -1.85% | |
| Price / MAexp100: | -3.76% |
News
The last news published on NEXANS at the time of the generation of this analysis was as follows:
- Information on share capital and voting rights - July 2023
- Availability of the 2023 half-year financial report
- SOLID H1 2023 PERFORMANCE DRIVING GUIDANCE UPGRADE
- Nexans to build third generation cable laying vessel to drive global energy transition
- Nexans welcomes Pascal Radue as Executive Vice President Generation & Transmission and member of the Executive Committee
About author
Online


Add a comment
Comments
0 comments on the analysis NEXANS - Daily