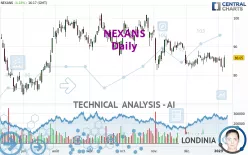
NEXANS - Daily - Technical analysis published on 01/06/2023 (GMT)
- 216
- 0
Click here for a new analysis!
- Timeframe : Daily
- - Analysis generated on
- Status : INVALID

Summary of the analysis

Additional analysis
Quotes
NEXANS rating 86.05 EUR. The price has increased by +4.18% since the last closing and was traded between 82.60 EUR and 86.80 EUR over the period. The price is currently at +4.18% from its lowest and -0.86% from its highest.The Central Gaps scanner detects a bullish opening. A small advantage for buyers in the very short term.
Bullish opening
Type : Bullish
Timeframe : Openning
Here is a more detailed summary of the historical variations registered by NEXANS:
New HIGH record (1st january)
Type : Bullish
Timeframe : Weekly
Near a new HIGH record (1 month)
Type : Bullish
Timeframe : Weekly
Technical
Technical analysis of NEXANS in Daily shows an overall bearish trend. 71.43% of the signals given by moving averages are bearish. Caution: the neutral signals currently given by short-term moving averages show us that the global trend is losing momentum. An assessment of moving averages reveals a bullish signal that could impact this trend:
Bullish price crossover with Moving Average 20
Type : Bullish
Timeframe : Daily
In fact, according to the parameters integrated into the Central Analyzer system, only 8 technical indicators out of 18 analysed are currently bullish. Caution: the Central Indicators scanner currently detects an excess:
Previous candle closed under Bollinger bands
Type : Neutral
Timeframe : Daily
Pivot points : price is over resistance 1
Type : Neutral
Timeframe : Weekly
Pivot points : price is over resistance 3
Type : Neutral
Timeframe : Daily
RSI indicator is back over 50
Type : Bullish
Timeframe : Daily
MACD crosses UP its Moving Average
Type : Bullish
Timeframe : Daily
Parabolic SAR indicator bullish reversal
Type : Bullish
Timeframe : Daily
Williams %R indicator is back over -50
Type : Bullish
Timeframe : Daily
The analysis of the price chart with Central Patterns scanners does not return any result.
Central Candlesticks, the scanner specialised in Japanese candlesticks, detects a bullish signal that could support the hypothesis of a small rebound in the very short term:
White morning star
Type : Bullish
Timeframe : Daily
| S3 | S2 | S1 | Price | R1 | R2 | R3 | |
|---|---|---|---|---|---|---|---|
| ProTrendLines | 75.54 | 79.04 | 83.70 | 86.05 | 87.65 | 91.30 | 95.15 |
| Change (%) | -12.21% | -8.15% | -2.73% | - | +1.86% | +6.10% | +10.58% |
| Change | -10.51 | -7.01 | -2.35 | - | +1.60 | +5.25 | +9.10 |
| Level | Intermediate | Minor | Major | - | Minor | Intermediate | Intermediate |
Pivot points can also be used to set your price objectives. Here is the price situation in relation to pivot points:
| Pivot points | S3 | S2 | S1 | PP | R1 | R2 | R3 |
|---|---|---|---|---|---|---|---|
| Standard | 79.47 | 80.33 | 81.47 | 82.33 | 83.47 | 84.33 | 85.47 |
| Camarilla | 82.05 | 82.23 | 82.42 | 82.60 | 82.78 | 82.97 | 83.15 |
| Woodie | 79.60 | 80.40 | 81.60 | 82.40 | 83.60 | 84.40 | 85.60 |
| Fibonacci | 80.33 | 81.10 | 81.57 | 82.33 | 83.10 | 83.57 | 84.33 |
| Pivot points | S3 | S2 | S1 | PP | R1 | R2 | R3 |
|---|---|---|---|---|---|---|---|
| Standard | 80.88 | 82.52 | 83.48 | 85.12 | 86.08 | 87.72 | 88.68 |
| Camarilla | 83.74 | 83.97 | 84.21 | 84.45 | 84.69 | 84.93 | 85.17 |
| Woodie | 80.55 | 82.35 | 83.15 | 84.95 | 85.75 | 87.55 | 88.35 |
| Fibonacci | 82.52 | 83.51 | 84.12 | 85.12 | 86.11 | 86.72 | 87.72 |
| Pivot points | S3 | S2 | S1 | PP | R1 | R2 | R3 |
|---|---|---|---|---|---|---|---|
| Standard | 75.52 | 78.88 | 81.67 | 85.03 | 87.82 | 91.18 | 93.97 |
| Camarilla | 82.76 | 83.32 | 83.89 | 84.45 | 85.01 | 85.58 | 86.14 |
| Woodie | 75.23 | 78.74 | 81.38 | 84.89 | 87.53 | 91.04 | 93.68 |
| Fibonacci | 78.88 | 81.23 | 82.68 | 85.03 | 87.38 | 88.83 | 91.18 |
Numerical data
The following are the details of the technical indicators and moving averages that were collected to generate this technical analysis:
| RSI (14): | 50.38 | |
| MACD (12,26,9): | -0.8600 | |
| Directional Movement: | -2.42 | |
| AROON (14): | -71.43 | |
| DEMA (21): | 84.27 | |
| Parabolic SAR (0,02-0,02-0,2): | 81.20 | |
| Elder Ray (13): | -0.38 | |
| Super Trend (3,10): | 88.24 | |
| Zig ZAG (10): | 86.10 | |
| VORTEX (21): | 0.9700 | |
| Stochastique (14,3,5): | 31.58 | |
| TEMA (21): | 84.51 | |
| Williams %R (14): | -26.32 | |
| Chande Momentum Oscillator (20): | -0.15 | |
| Repulse (5,40,3): | 2.7900 | |
| ROCnROLL: | -1 | |
| TRIX (15,9): | -0.1400 | |
| Courbe Coppock: | 2.79 |
| MA7: | 84.70 | |
| MA20: | 85.52 | |
| MA50: | 87.34 | |
| MA100: | 90.90 | |
| MAexp7: | 84.72 | |
| MAexp20: | 85.48 | |
| MAexp50: | 87.36 | |
| MAexp100: | 88.47 | |
| Price / MA7: | +1.59% | |
| Price / MA20: | +0.62% | |
| Price / MA50: | -1.48% | |
| Price / MA100: | -5.34% | |
| Price / MAexp7: | +1.57% | |
| Price / MAexp20: | +0.67% | |
| Price / MAexp50: | -1.50% | |
| Price / MAexp100: | -2.74% |
News
Don't forget to follow the news on NEXANS. At the time of publication of this analysis, the latest news was as follows:
- Information on share capital and voting rights - December 2022
- Disclosure of trading in own shares from December 27, 2022 to December 30, 2022
- Disclosure of trading in own shares from December 19, 2022 to December 23, 2022
- Disclosure of trading in own shares from December 12, 2022 to December 16, 2022
- Disclosure of trading in own shares from November 28, 2022 to December 2, 2022
About author
Online


Add a comment
Comments
0 comments on the analysis NEXANS - Daily