| Open: | - |
| Change: | - |
| Volume: | - |
| Low: | - |
| High: | - |
| High / Low range: | - |
| Type: | Stocks |
| Ticker: | MPT |
| ISIN: | IT0005518953 |
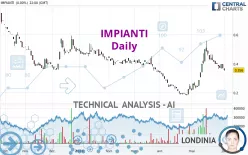
IMPIANTI - Daily - Technical analysis published on 06/04/2024 (GMT)
- 95
- 0
- 06/04/2024 - 13:35
- Timeframe : Daily
- - Analysis generated on 06/04/2024 - 13:35
- Status : NEUTRAL

Summary of the analysis

Additional analysis
Quotes
IMPIANTI rating 0.388 EUR. On the day, this instrument gained +8.99% and was between 0.366 EUR and 0.394 EUR. This implies that the price is at +6.01% from its lowest and at -1.52% from its highest.A bullish opening was detected by the Central Gaps scanner. Buyers are trying to impose a bullish momentum in the very short term.
Bullish opening
Type : Bullish
Timeframe : Openning
Here is a more detailed summary of the historical variations registered by IMPIANTI:
Abnormal volumes
Timeframe : 20 days
Abnormal volumes
Timeframe : 50 days
Technical
Technical analysis of IMPIANTI in Daily shows a neutral overall trend. This indecision could turn into a bullish trend due to the slightly bullish signals currently given by short-term moving averages. The Central Indicators scanner detects a bullish signal on moving averages that could impact this trend:
Bullish price crossover with Moving Average 100
Type : Bullish
Timeframe : Daily
An assessment of technical indicators does not currently provide any relevant information on the direction of future price movements.
Caution: the Central Indicators scanner currently detects an excess:
Williams %R indicator is oversold : under -80
Type : Neutral
Timeframe : Daily
Pivot points : price is over resistance 3
Type : Neutral
Timeframe : Daily
RSI indicator is back over 50
Type : Bullish
Timeframe : Daily
Price is back over the pivot point
Type : Bullish
Timeframe : Weekly
The Central Patterns scanner, which studies chart patterns, resistances and supports, has identified this signal:
Near horizontal resistance
Type : Bearish
Timeframe : Daily
Central Candlesticks, the scanner specialised in Japanese candlesticks, detects a bullish signal that could support the hypothesis of a small rebound in the very short term:
White morning star
Type : Bullish
Timeframe : Daily
| S1 | Price | R1 | R2 | R3 | |
|---|---|---|---|---|---|
| ProTrendLines | 0.190 | 0.388 | 0.392 | 0.501 | 0.889 |
| Change (%) | -51.03% | - | +1.03% | +29.12% | +129.12% |
| Change | -0.198 | - | +0.004 | +0.113 | +0.501 |
| Level | Intermediate | - | Minor | Intermediate | Intermediate |
Pivot points can also be used to set your price objectives. Here is the price situation in relation to pivot points:
| Pivot points | S3 | S2 | S1 | PP | R1 | R2 | R3 |
|---|---|---|---|---|---|---|---|
| Standard | 0.327 | 0.339 | 0.347 | 0.359 | 0.367 | 0.379 | 0.387 |
| Camarilla | 0.351 | 0.352 | 0.354 | 0.356 | 0.358 | 0.360 | 0.362 |
| Woodie | 0.326 | 0.338 | 0.346 | 0.358 | 0.366 | 0.378 | 0.386 |
| Fibonacci | 0.339 | 0.346 | 0.351 | 0.359 | 0.366 | 0.371 | 0.379 |
| Pivot points | S3 | S2 | S1 | PP | R1 | R2 | R3 |
|---|---|---|---|---|---|---|---|
| Standard | 0.309 | 0.335 | 0.353 | 0.379 | 0.397 | 0.423 | 0.441 |
| Camarilla | 0.358 | 0.362 | 0.366 | 0.370 | 0.374 | 0.378 | 0.382 |
| Woodie | 0.304 | 0.333 | 0.348 | 0.377 | 0.392 | 0.421 | 0.436 |
| Fibonacci | 0.335 | 0.352 | 0.363 | 0.379 | 0.396 | 0.407 | 0.423 |
| Pivot points | S3 | S2 | S1 | PP | R1 | R2 | R3 |
|---|---|---|---|---|---|---|---|
| Standard | -0.147 | 0.033 | 0.201 | 0.381 | 0.549 | 0.729 | 0.897 |
| Camarilla | 0.274 | 0.306 | 0.338 | 0.370 | 0.402 | 0.434 | 0.466 |
| Woodie | -0.152 | 0.030 | 0.196 | 0.378 | 0.544 | 0.726 | 0.892 |
| Fibonacci | 0.033 | 0.166 | 0.248 | 0.381 | 0.514 | 0.596 | 0.729 |
Numerical data
The following is the status of technical indicators and moving averages registered at the time this technical analysis was created:
| RSI (14): | 54.34 | |
| MACD (12,26,9): | 0.0190 | |
| Directional Movement: | 12.973 | |
| AROON (14): | -85.714 | |
| DEMA (21): | 0.404 | |
| Parabolic SAR (0,02-0,02-0,2): | 0.492 | |
| Elder Ray (13): | -0.005 | |
| Super Trend (3,10): | 0.454 | |
| Zig ZAG (10): | 0.388 | |
| VORTEX (21): | 1.0810 | |
| Stochastique (14,3,5): | 8.33 | |
| TEMA (21): | 0.412 | |
| Williams %R (14): | -81.91 | |
| Chande Momentum Oscillator (20): | -0.082 | |
| Repulse (5,40,3): | 1.2350 | |
| ROCnROLL: | 1 | |
| TRIX (15,9): | 1.4100 | |
| Courbe Coppock: | 9.43 |
| MA7: | 0.382 | |
| MA20: | 0.396 | |
| MA50: | 0.317 | |
| MA100: | 0.378 | |
| MAexp7: | 0.384 | |
| MAexp20: | 0.375 | |
| MAexp50: | 0.356 | |
| MAexp100: | 0.402 | |
| Price / MA7: | +1.57% | |
| Price / MA20: | -2.02% | |
| Price / MA50: | +22.40% | |
| Price / MA100: | +2.65% | |
| Price / MAexp7: | +1.04% | |
| Price / MAexp20: | +3.47% | |
| Price / MAexp50: | +8.99% | |
| Price / MAexp100: | -3.48% |
About author
Online


Add a comment
Comments
0 comments on the analysis IMPIANTI - Daily