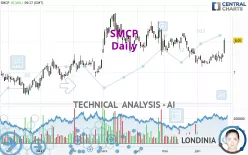
SMCP - Daily - Technical analysis published on 06/27/2023 (GMT)
- 261
- 0
Click here for a new analysis!
- Timeframe : Daily
- - Analysis generated on
- Status : TARGET REACHED

Summary of the analysis

Additional analysis
Quotes
The SMCP price is 8.05 EUR. On the day, this instrument gained +6.34% with the lowest point at 7.61 EUR and the highest point at 8.12 EUR. The deviation from the price is +5.78% for the low point and -0.86% for the high point.A bullish gap was detected at the opening by the Central Gaps scanner. There are a lot of buyers and they have the upper hand in the very short term.
Opening Gap UP
Type : Bullish
Timeframe : Openning
Here is a more detailed summary of the historical variations registered by SMCP:
New HIGH record (1 month)
Type : Bullish
Timeframe : Weekly
Technical
Technical analysis of SMCP in Daily shows an overall bullish trend. The signals returned by the moving averages are 67.86% bullish. This bullish trend is reinforced by the strong signals currently being given by short-term moving averages. An assessment of moving averages reveals several bullish signals that could impact this trend:
Bullish trend reversal : adaptative moving average 20
Type : Bullish
Timeframe : Daily
Bullish price crossover with Moving Average 50
Type : Bullish
Timeframe : Daily
Bullish price crossover with Moving Average 100
Type : Bullish
Timeframe : Daily
Bullish price crossover with adaptative moving average 20
Type : Bullish
Timeframe : Daily
Bullish price crossover with adaptative moving average 50
Type : Bullish
Timeframe : Daily
Bullish price crossover with adaptative moving average 100
Type : Bullish
Timeframe : Daily
The probability of a further increase is high given the direction of the technical indicators.
Caution: the Central Indicators scanner currently detects an excess:
CCI indicator is overbought : over 100
Type : Neutral
Timeframe : Daily
Williams %R indicator is overbought : over -20
Type : Neutral
Timeframe : Daily
Pivot points : price is over resistance 3
Type : Neutral
Timeframe : Daily
Pivot points : price is over resistance 3
Type : Neutral
Timeframe : Weekly
SuperTrend indicator bullish reversal
Type : Bullish
Timeframe : Daily
Ichimoku - Bullish crossover : Tenkan & Kijun
Type : Bullish
Timeframe : Daily
Central Patterns, the market scanner focusing on chart patterns, resistances and supports found these results:
Near resistance of channel
Type : Bearish
Timeframe : Daily
Horizontal resistance is broken
Type : Bullish
Timeframe : Daily
Resistance of triangle is broken
Type : Bullish
Timeframe : Daily
The Central Candlesticks scanner, specialised in Japanese candlesticks, did not identify any signals.
| S3 | S2 | S1 | Price | R1 | R2 | R3 | |
|---|---|---|---|---|---|---|---|
| ProTrendLines | 6.32 | 7.27 | 7.70 | 8.05 | 8.23 | 8.55 | 8.90 |
| Change (%) | -21.49% | -9.69% | -4.35% | - | +2.24% | +6.21% | +10.56% |
| Change | -1.73 | -0.78 | -0.35 | - | +0.18 | +0.50 | +0.85 |
| Level | Intermediate | Major | Intermediate | - | Intermediate | Major | Minor |
To determine price objectives, it is also possible to use the pivot points. Here is the price position in relation to pivot points:
| Pivot points | S3 | S2 | S1 | PP | R1 | R2 | R3 |
|---|---|---|---|---|---|---|---|
| Standard | 7.32 | 7.40 | 7.48 | 7.56 | 7.64 | 7.72 | 7.80 |
| Camarilla | 7.53 | 7.54 | 7.56 | 7.57 | 7.59 | 7.60 | 7.61 |
| Woodie | 7.33 | 7.40 | 7.49 | 7.56 | 7.65 | 7.72 | 7.81 |
| Fibonacci | 7.40 | 7.46 | 7.50 | 7.56 | 7.62 | 7.66 | 7.72 |
| Pivot points | S3 | S2 | S1 | PP | R1 | R2 | R3 |
|---|---|---|---|---|---|---|---|
| Standard | 6.99 | 7.16 | 7.34 | 7.51 | 7.69 | 7.86 | 8.04 |
| Camarilla | 7.41 | 7.45 | 7.48 | 7.51 | 7.54 | 7.57 | 7.61 |
| Woodie | 6.99 | 7.16 | 7.34 | 7.51 | 7.69 | 7.86 | 8.04 |
| Fibonacci | 7.16 | 7.30 | 7.38 | 7.51 | 7.65 | 7.73 | 7.86 |
| Pivot points | S3 | S2 | S1 | PP | R1 | R2 | R3 |
|---|---|---|---|---|---|---|---|
| Standard | 6.03 | 6.67 | 7.00 | 7.64 | 7.97 | 8.61 | 8.94 |
| Camarilla | 7.05 | 7.14 | 7.23 | 7.32 | 7.41 | 7.50 | 7.59 |
| Woodie | 5.87 | 6.59 | 6.84 | 7.56 | 7.81 | 8.53 | 8.78 |
| Fibonacci | 6.67 | 7.04 | 7.27 | 7.64 | 8.01 | 8.24 | 8.61 |
Numerical data
The following is the status of technical indicators and moving averages registered at the time this technical analysis was created:
| RSI (14): | 67.79 | |
| MACD (12,26,9): | -0.0100 | |
| Directional Movement: | 12.22 | |
| AROON (14): | 78.57 | |
| DEMA (21): | 7.53 | |
| Parabolic SAR (0,02-0,02-0,2): | 7.26 | |
| Elder Ray (13): | 0.29 | |
| Super Trend (3,10): | 7.21 | |
| Zig ZAG (10): | 8.10 | |
| VORTEX (21): | 0.9900 | |
| Stochastique (14,3,5): | 75.97 | |
| TEMA (21): | 7.61 | |
| Williams %R (14): | -8.24 | |
| Chande Momentum Oscillator (20): | 0.80 | |
| Repulse (5,40,3): | 9.0200 | |
| ROCnROLL: | 1 | |
| TRIX (15,9): | -0.1800 | |
| Courbe Coppock: | 6.52 |
| MA7: | 7.58 | |
| MA20: | 7.46 | |
| MA50: | 7.78 | |
| MA100: | 7.81 | |
| MAexp7: | 7.64 | |
| MAexp20: | 7.58 | |
| MAexp50: | 7.68 | |
| MAexp100: | 7.60 | |
| Price / MA7: | +6.20% | |
| Price / MA20: | +7.91% | |
| Price / MA50: | +3.47% | |
| Price / MA100: | +3.07% | |
| Price / MAexp7: | +5.37% | |
| Price / MAexp20: | +6.20% | |
| Price / MAexp50: | +4.82% | |
| Price / MAexp100: | +5.92% |
News
The latest news and videos published on SMCP at the time of the analysis were as follows:
- Leading French accessible luxury fashion group SMCP chooses Openbravo to reinforce its premium shopping experience
- Press Release - SMCP - 2023 Q1 Sales
- SMCP - 2022 Universal registration document available
- SMCP - Elina Kousourna is appointed CEO of Maje
- SMCP - Olivier Germain is appointed CEO of Claudie Pierlot
About author
Online


Add a comment
Comments
0 comments on the analysis SMCP - Daily