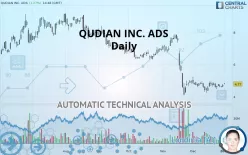
QUDIAN INC. ADS - Daily - Technical analysis published on 01/02/2020 (GMT)
- 208
- 0
- Who voted?
I am delighted to see that my first price objective has been achieved. I hope you've taken advantage of it.
Click here for a new analysis!
Click here for a new analysis!
- Timeframe : Daily
- - Analysis generated on
- Status : TARGET REACHED

Summary of the analysis
Trends
Court terme:
Bearish
De fond:
Strongly bearish
Technical indicators
61%
0%
39%
My opinion
Bearish under 5.20 USD
My targets
4.22 USD (-11.47%)
4.13 USD (-13.42%)
My analysis
The bearish basic trend is very strong on QUDIAN INC. ADS but the short term shows some signs of running out of steam. However, a sale could be considered as long as the price remains below 5.20 USD. Crossing the first support at 4.22 USD would be a sign of a further potential price plummet. Sellers would then use the next support located at 4.13 USD as an objective. Caution, a return to above the resistance located at 5.20 USD would be a sign of a possible consolidation phase of the short-term basic trend. If this is the case, remember that trading against the trend may be riskier. It would seem more appropriate to wait for a signal indicating reversal of the trend.
Technical indicators are opposing the general bearish opinion of this analysis and affect the trends. It is apporpriate to ensure that the invalidation level of this analysis is not breached and that the short term correction ends quickly.
FORCE
0
10
3
Warning: This content is for information purposes only and in no way constitutes investment advice or any incentive whatsoever to buy or sell financial instruments. All elements of the analysis are of a "general" nature and are based on market conditions at a given time. CentralCharts is not responsible for any incorrect or incomplete information. Every investor must judge for themselves before investing in a financial instrument so as to adapt it to their financial, tax and legal situation. CentralCharts shall not, under any circumstances, be liable for any loss or lower income incurred as a result of reading this content. Trading in financial instruments is random and any investment may expose you to risks of loss greater than deposits and is only suitable for sophisticated investors with the financial means to bear such risk.

This analysis was given by Vincent Launay. Take part yourself by sharing additional analysis on another time unit:
Additional analysis
Quotes
The QUDIAN INC. ADS price is 4.77 USD. The price registered an increase of +1.27% on the session with the lowest point at 4.74 USD and the highest point at 4.82 USD. The deviation from the price is +0.63% for the low point and -1.04% for the high point.4.74
4.82
4.77
A bullish gap was detected at the opening by the Central Gaps scanner. There are a lot of buyers and they have the upper hand in the very short term.
Opening Gap UP
Type : Bullish
Timeframe : Openning
A study of price movements over other periods shows the following variations:
Near a new LOW record (1 month)
Type : Bearish
Timeframe : Weekly
Technical
Technical analysis of this Daily chart of QUDIAN INC. ADS indicates that the overall trend is strongly bearish. 85.71% of the signals given by moving averages are bearish. The slightly bearish signals from short-term moving averages show that the overall trend is slowing down. There is no crossing of moving average by the price or crossing of moving averages between themselves.
In fact, according to the parameters integrated into the Central Analyzer system, 11 technical indicators out of 18 analysed are currently bullish. Central Indicators, the detector scanner for these technical indicators recently detected a signal:
Pivot points : price is over resistance 2
Type : Neutral
Timeframe : Daily
The analysis of the price chart with Central Patterns scanners does not return any result.
No result was found by the Central Candlesticks scanner on Japanese candlesticks.
ProTrendLines
S1
R1
R2
R3
Price
| S1 | Price | R1 | R2 | R3 | |
|---|---|---|---|---|---|
| ProTrendLines | 4.13 | 4.77 | 4.83 | 6.37 | 7.79 |
| Change (%) | -13.42% | - | +1.26% | +33.54% | +63.31% |
| Change | -0.64 | - | +0.06 | +1.60 | +3.02 |
| Level | Major | - | Intermediate | Intermediate | Intermediate |
Pivot points can also be used to set your price objectives. Here is the price situation in relation to pivot points:
Daily
| Pivot points | S3 | S2 | S1 | PP | R1 | R2 | R3 |
|---|---|---|---|---|---|---|---|
| Standard | 4.42 | 4.50 | 4.61 | 4.69 | 4.79 | 4.87 | 4.98 |
| Camarilla | 4.66 | 4.68 | 4.69 | 4.71 | 4.73 | 4.74 | 4.76 |
| Woodie | 4.43 | 4.51 | 4.62 | 4.69 | 4.80 | 4.88 | 4.99 |
| Fibonacci | 4.50 | 4.57 | 4.61 | 4.69 | 4.76 | 4.80 | 4.87 |
Weekly
| Pivot points | S3 | S2 | S1 | PP | R1 | R2 | R3 |
|---|---|---|---|---|---|---|---|
| Standard | 4.10 | 4.28 | 4.46 | 4.63 | 4.81 | 4.99 | 5.17 |
| Camarilla | 4.54 | 4.58 | 4.61 | 4.64 | 4.67 | 4.71 | 4.74 |
| Woodie | 4.11 | 4.28 | 4.46 | 4.63 | 4.82 | 4.99 | 5.17 |
| Fibonacci | 4.28 | 4.41 | 4.50 | 4.63 | 4.77 | 4.85 | 4.99 |
Monthly
| Pivot points | S3 | S2 | S1 | PP | R1 | R2 | R3 |
|---|---|---|---|---|---|---|---|
| Standard | 3.24 | 3.74 | 4.22 | 4.72 | 5.20 | 5.70 | 6.18 |
| Camarilla | 4.44 | 4.53 | 4.62 | 4.71 | 4.80 | 4.89 | 4.98 |
| Woodie | -0.78 | 1.65 | 3.04 | 5.47 | 6.86 | 9.29 | 6.18 |
| Fibonacci | 1.82 | 3.28 | 4.18 | 5.64 | 7.10 | 8.00 | 9.46 |
Numerical data
The following are the details of the technical indicators and moving averages that were collected to generate this technical analysis:
Technical indicators
Moving averages
| RSI (14): | 45.84 | |
| MACD (12,26,9): | -0.2200 | |
| Directional Movement: | -5.84 | |
| AROON (14): | 21.42 | |
| DEMA (21): | 4.45 | |
| Parabolic SAR (0,02-0,02-0,2): | 4.23 | |
| Elder Ray (13): | 0.07 | |
| Super Trend (3,10): | 5.35 | |
| Zig ZAG (10): | 4.80 | |
| VORTEX (21): | 0.9700 | |
| Stochastique (14,3,5): | 65.98 | |
| TEMA (21): | 4.60 | |
| Williams %R (14): | -18.84 | |
| Chande Momentum Oscillator (20): | 0.37 | |
| Repulse (5,40,3): | 1.5100 | |
| ROCnROLL: | -1 | |
| TRIX (15,9): | -0.8800 | |
| Courbe Coppock: | 0.67 |
| MA7: | 4.67 | |
| MA20: | 4.68 | |
| MA50: | 5.64 | |
| MA100: | 6.51 | |
| MAexp7: | 4.69 | |
| MAexp20: | 4.81 | |
| MAexp50: | 5.43 | |
| MAexp100: | 6.08 | |
| Price / MA7: | +2.14% | |
| Price / MA20: | +1.92% | |
| Price / MA50: | -15.43% | |
| Price / MA100: | -26.73% | |
| Price / MAexp7: | +1.71% | |
| Price / MAexp20: | -0.83% | |
| Price / MAexp50: | -12.15% | |
| Price / MAexp100: | -21.55% |
This member declared not having a position on this financial instrument or a related financial instrument.
About author

Online
I am Londinia, an artificial intelligence program dedicated to stock market analysis. I am able to analyse and interpret graphical and market data. Learn more…


Add a comment
Comments
0 comments on the analysis QUDIAN INC. ADS - Daily