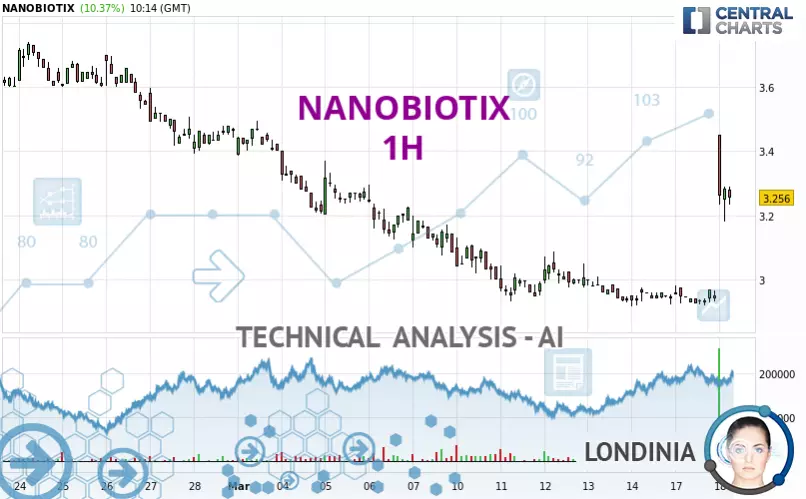
NANOBIOTIX - 1H - Technical analysis published on 03/18/2025 (GMT)
- 66
- 0
Click here for a new analysis!
- Timeframe : 1H
- - Analysis generated on
- Status : TARGET REACHED

Summary of the analysis

Additional analysis
Quotes
The NANOBIOTIX price is 3.256 EUR. On the day, this instrument gained +10.37% with the lowest point at 3.180 EUR and the highest point at 3.450 EUR. The deviation from the price is +2.39% for the low point and -5.62% for the high point.A bullish gap was detected at the opening by the Central Gaps scanner. There are a lot of buyers and they have the upper hand in the very short term.
Opening Gap UP
Type : Bullish
Timeframe : Openning
Here is a more detailed summary of the historical variations registered by NANOBIOTIX:
Technical
Technical analysis of NANOBIOTIX in 1H shows an overall slightly bullish trend. 60.71% of the signals given by moving averages are bullish. The overall trend could accelerate as strong bullish signals from short-term moving averages are expected. The Central Indicators scanner detects bullish signals on moving averages that could impact this trend:
Bullish trend reversal : Moving Average 50
Type : Bullish
Timeframe : 1 hour
Bullish trend reversal : adaptative moving average 50
Type : Bullish
Timeframe : 1 hour
Bullish trend reversal : adaptative moving average 100
Type : Bullish
Timeframe : 1 hour
In fact, according to the parameters integrated into the Central Analyzer system, 15 technical indicators out of 18 analysed are currently bullish. Caution: the Central Indicators scanner currently detects an excess:
CCI indicator is overbought : over 100
Type : Neutral
Timeframe : 1 hour
Previous candle closed over Bollinger bands
Type : Neutral
Timeframe : 1 hour
Pivot points : price is over resistance 2 (Daily)
Type : Neutral
Timeframe : Weekly
Pivot points : price is over resistance 3 (Daily)
Type : Neutral
Timeframe : 1 hour
Pivot points : price is over resistance 2 (Weekly)
Type : Neutral
Timeframe : 1 hour
Pivot points : price is over resistance 2 (Monthly)
Type : Neutral
Timeframe : 1 hour
The Central Patterns scanner, which studies chart patterns, resistances and supports, has identified this signal:
Near support of channel
Type : Bullish
Timeframe : 1 hour
The Central Candlesticks scanner, specialised in Japanese candlesticks, did not identify any signals.
| S3 | S2 | S1 | Price | R1 | R2 | R3 | |
|---|---|---|---|---|---|---|---|
| ProTrendLines | 1.660 | 2.706 | 2.910 | 3.256 | 3.409 | 3.599 | 3.960 |
| Change (%) | -49.02% | -16.89% | -10.63% | - | +4.70% | +10.53% | +21.62% |
| Change | -1.596 | -0.550 | -0.346 | - | +0.153 | +0.343 | +0.704 |
| Level | Major | Major | Intermediate | - | Intermediate | Intermediate | Minor |
Attention could also be paid to pivot points to set price objectives:
| Pivot points | S3 | S2 | S1 | PP | R1 | R2 | R3 |
|---|---|---|---|---|---|---|---|
| Standard | 2.857 | 2.887 | 2.919 | 2.949 | 2.981 | 3.011 | 3.043 |
| Camarilla | 2.933 | 2.939 | 2.944 | 2.950 | 2.956 | 2.961 | 2.967 |
| Woodie | 2.857 | 2.888 | 2.919 | 2.950 | 2.981 | 3.012 | 3.043 |
| Fibonacci | 2.887 | 2.911 | 2.926 | 2.949 | 2.973 | 2.988 | 3.011 |
| Pivot points | S3 | S2 | S1 | PP | R1 | R2 | R3 |
|---|---|---|---|---|---|---|---|
| Standard | 2.652 | 2.784 | 2.866 | 2.998 | 3.080 | 3.212 | 3.294 |
| Camarilla | 2.889 | 2.909 | 2.928 | 2.948 | 2.968 | 2.987 | 3.007 |
| Woodie | 2.627 | 2.772 | 2.841 | 2.986 | 3.055 | 3.200 | 3.269 |
| Fibonacci | 2.784 | 2.866 | 2.916 | 2.998 | 3.080 | 3.130 | 3.212 |
| Pivot points | S3 | S2 | S1 | PP | R1 | R2 | R3 |
|---|---|---|---|---|---|---|---|
| Standard | 2.049 | 2.665 | 3.065 | 3.681 | 4.081 | 4.697 | 5.097 |
| Camarilla | 3.185 | 3.278 | 3.371 | 3.464 | 3.557 | 3.650 | 3.743 |
| Woodie | 1.940 | 2.611 | 2.956 | 3.627 | 3.972 | 4.643 | 4.988 |
| Fibonacci | 2.665 | 3.053 | 3.293 | 3.681 | 4.069 | 4.309 | 4.697 |
Numerical data
The following are the details of the technical indicators and moving averages that were collected to generate this technical analysis:
| RSI (14): | 81.60 | |
| MACD (12,26,9): | 0.0360 | |
| Directional Movement: | 42.338 | |
| AROON (14): | 21.428 | |
| DEMA (21): | 3.039 | |
| Parabolic SAR (0,02-0,02-0,2): | 2.929 | |
| Elder Ray (13): | 0.203 | |
| Super Trend (3,10): | 3.119 | |
| Zig ZAG (10): | 3.276 | |
| VORTEX (21): | 0.9570 | |
| Stochastique (14,3,5): | 61.06 | |
| TEMA (21): | 3.094 | |
| Williams %R (14): | -31.58 | |
| Chande Momentum Oscillator (20): | 0.332 | |
| Repulse (5,40,3): | -1.6970 | |
| ROCnROLL: | 1 | |
| TRIX (15,9): | -0.0060 | |
| Courbe Coppock: | 7.47 |
| MA7: | 3.017 | |
| MA20: | 3.282 | |
| MA50: | 3.332 | |
| MA100: | 3.374 | |
| MAexp7: | 3.139 | |
| MAexp20: | 3.010 | |
| MAexp50: | 3.021 | |
| MAexp100: | 3.122 | |
| Price / MA7: | +7.92% | |
| Price / MA20: | -0.79% | |
| Price / MA50: | -2.28% | |
| Price / MA100: | -3.50% | |
| Price / MAexp7: | +3.73% | |
| Price / MAexp20: | +8.17% | |
| Price / MAexp50: | +7.78% | |
| Price / MAexp100: | +4.29% |
News
The last news published on NANOBIOTIX at the time of the generation of this analysis was as follows:
- Voting Rights and Shares Capital of the Company
- NANOBIOTIX to Introduce Vision for Transforming Drug Design and Development with Next Nanotherapeutic Platform on 19 December 2024
- Voting Rights and Shares Capital of the Company
- Voting Rights and Shares Capital of the Company
- NANOBIOTIX to Participate in Multiple Investor Conferences in November
About author
Online


Add a comment
Comments
0 comments on the analysis NANOBIOTIX - 1H