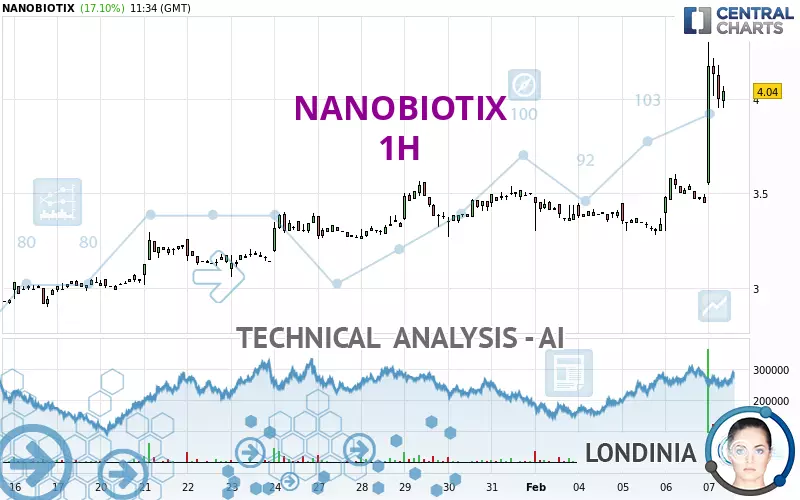
NANOBIOTIX - 1H - Technical analysis published on 02/07/2025 (GMT)
- 63
- 0
Click here for a new analysis!
- Timeframe : 1H
- - Analysis generated on
- Status : INVALID

Summary of the analysis

Additional analysis
Quotes
NANOBIOTIX rating 4.040 EUR. The price registered an increase of +17.10% on the session and was between 3.546 EUR and 4.298 EUR. This implies that the price is at +13.93% from its lowest and at -6.00% from its highest.The Central Gaps scanner detects a bullish opening marking the presence of buyers ahead of sellers at the opening but not sufficiently marked to allow the price to register a quotation gap.
Bullish opening
Type : Bullish
Timeframe : Openning
A study of price movements over other periods shows the following variations:
New HIGH record (1st january)
Type : Bullish
Timeframe : Weekly
New HIGH record (1 month)
Type : Bullish
Timeframe : Weekly
The Central Volumes scanner detects abnormal volumes on the asset:
Abnormal volumes
Timeframe : 5 days
Technical
Technical analysis of NANOBIOTIX in 1H shows a strongly overall bullish trend. 92.86% of the signals given by moving averages are bullish. The overall trend is supported by the strong bullish signals from short-term moving averages. The Central Indicators market scanner currently does not detect any result that concerns moving averages.
Technical indicators are strongly bullish, suggesting that the price increase should continue.
Caution: the Central Indicators scanner currently detects an excess:
RSI indicator is overbought : over 70
Type : Neutral
Timeframe : 1 hour
CCI indicator is overbought : over 100
Type : Neutral
Timeframe : 1 hour
Pivot points : price is over resistance 3
Type : Neutral
Timeframe : 1 hour
Pivot points : price is over resistance 3
Type : Neutral
Timeframe : Weekly
The Central Patterns scanner, which studies chart patterns, resistances and supports, has identified this signal:
Resistance of channel is broken
Type : Bullish
Timeframe : 1 hour
The Central Candlesticks scanner, specialised in Japanese candlesticks, did not identify any signals.
| S3 | S2 | S1 | Price | R1 | R2 | R3 | |
|---|---|---|---|---|---|---|---|
| ProTrendLines | 3.493 | 3.600 | 3.960 | 4.040 | 4.309 | 5.700 | 6.761 |
| Change (%) | -13.54% | -10.89% | -1.98% | - | +6.66% | +41.09% | +67.35% |
| Change | -0.547 | -0.440 | -0.080 | - | +0.269 | +1.660 | +2.721 |
| Level | Major | Major | Intermediate | - | Intermediate | Minor | Major |
Pivot points can also be used to set your price objectives. Here is the price situation in relation to pivot points:
| Pivot points | S3 | S2 | S1 | PP | R1 | R2 | R3 |
|---|---|---|---|---|---|---|---|
| Standard | 3.000 | 3.150 | 3.300 | 3.450 | 3.600 | 3.750 | 3.900 |
| Camarilla | 3.368 | 3.395 | 3.423 | 3.450 | 3.478 | 3.505 | 3.533 |
| Woodie | 3.000 | 3.150 | 3.300 | 3.450 | 3.600 | 3.750 | 3.900 |
| Fibonacci | 3.150 | 3.265 | 3.335 | 3.450 | 3.565 | 3.635 | 3.750 |
| Pivot points | S3 | S2 | S1 | PP | R1 | R2 | R3 |
|---|---|---|---|---|---|---|---|
| Standard | 3.009 | 3.133 | 3.317 | 3.441 | 3.625 | 3.749 | 3.933 |
| Camarilla | 3.415 | 3.444 | 3.472 | 3.500 | 3.528 | 3.557 | 3.585 |
| Woodie | 3.038 | 3.148 | 3.346 | 3.456 | 3.654 | 3.764 | 3.962 |
| Fibonacci | 3.133 | 3.251 | 3.324 | 3.441 | 3.559 | 3.632 | 3.749 |
| Pivot points | S3 | S2 | S1 | PP | R1 | R2 | R3 |
|---|---|---|---|---|---|---|---|
| Standard | 2.295 | 2.563 | 3.031 | 3.299 | 3.767 | 4.035 | 4.503 |
| Camarilla | 3.298 | 3.365 | 3.433 | 3.500 | 3.568 | 3.635 | 3.702 |
| Woodie | 2.396 | 2.613 | 3.132 | 3.349 | 3.868 | 4.085 | 4.604 |
| Fibonacci | 2.563 | 2.844 | 3.018 | 3.299 | 3.580 | 3.754 | 4.035 |
Numerical data
The following are the details of the technical indicators and moving averages that were collected to generate this technical analysis:
| RSI (14): | 70.38 | |
| MACD (12,26,9): | 0.1520 | |
| Directional Movement: | 38.180 | |
| AROON (14): | 78.571 | |
| DEMA (21): | 3.819 | |
| Parabolic SAR (0,02-0,02-0,2): | 3.580 | |
| Elder Ray (13): | 0.268 | |
| Super Trend (3,10): | 3.694 | |
| Zig ZAG (10): | 4.024 | |
| VORTEX (21): | 1.1980 | |
| Stochastique (14,3,5): | 75.36 | |
| TEMA (21): | 3.944 | |
| Williams %R (14): | -27.46 | |
| Chande Momentum Oscillator (20): | 0.544 | |
| Repulse (5,40,3): | 3.0880 | |
| ROCnROLL: | 1 | |
| TRIX (15,9): | 0.3280 | |
| Courbe Coppock: | 28.32 |
| MA7: | 3.505 | |
| MA20: | 3.268 | |
| MA50: | 3.149 | |
| MA100: | 3.665 | |
| MAexp7: | 3.876 | |
| MAexp20: | 3.653 | |
| MAexp50: | 3.512 | |
| MAexp100: | 3.410 | |
| Price / MA7: | +15.26% | |
| Price / MA20: | +23.62% | |
| Price / MA50: | +28.29% | |
| Price / MA100: | +10.23% | |
| Price / MAexp7: | +4.23% | |
| Price / MAexp20: | +10.59% | |
| Price / MAexp50: | +15.03% | |
| Price / MAexp100: | +18.48% |
News
Don't forget to follow the news on NANOBIOTIX. At the time of publication of this analysis, the latest news was as follows:
- NANOBIOTIX to Introduce Vision for Transforming Drug Design and Development with Next Nanotherapeutic Platform on 19 December 2024
- Voting Rights and Shares Capital of the Company
- Voting Rights and Shares Capital of the Company
- NANOBIOTIX to Participate in Multiple Investor Conferences in November
- Voting Rights and Shares Capital of the Company
About author
Online


Add a comment
Comments
0 comments on the analysis NANOBIOTIX - 1H