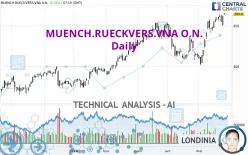
MUENCH.RUECKVERS.VNA O.N. - Daily - Technical analysis published on 05/27/2024 (GMT)
- 143
- 0
Click here for a new analysis!
- Timeframe : Daily
- - Analysis generated on
- Status : LEVEL MAINTAINED

Summary of the analysis

Additional analysis
Quotes
The MUENCH.RUECKVERS.VNA O.N. rating is 465.6 EUR. The price registered an increase of +0.76% on the session with the lowest point at 463.7 EUR and the highest point at 465.8 EUR. The deviation from the price is +0.41% for the low point and -0.04% for the high point.A bullish gap was detected at the opening by the Central Gaps scanner. There are a lot of buyers and they have the upper hand in the very short term.
Opening Gap UP
Type : Bullish
Timeframe : Openning
So that you have an overall view of the price change, here is a table showing the variations over several periods:
New HIGH record (5 years)
Type : Bullish
Timeframe : Weekly
Near a new HIGH record (1 year)
Type : Bullish
Timeframe : Weekly
Near a new HIGH record (1st january)
Type : Bullish
Timeframe : Weekly
Near a new HIGH record (1 month)
Type : Bullish
Timeframe : Weekly
Technical
Technical analysis of MUENCH.RUECKVERS.VNA O.N. in Daily shows a strongly overall bullish trend. The signals given by the moving averages are 92.86% bullish. This strong bullish trend is confirmed by the strong signals currently being given by short-term moving averages. The Central Indicators scanner does not detect any result on moving averages that would impact this trend.
The technical indicators are bullish. There is still some doubt about the price increase.
Caution: the Central Indicators scanner currently detects an excess:
Williams %R indicator is overbought : over -20
Type : Neutral
Timeframe : Daily
Central Patterns, the market scanner focusing on chart patterns, resistances and supports found this result:
Near horizontal support
Type : Bullish
Timeframe : Daily
Central Candlesticks, the scanner specialised in Japanese candlesticks, detects these signals that could have an impact on the current short-term trend:
Upside gap
Type : Bullish
Timeframe : Daily
Bearish doji star
Type : Bearish
Timeframe : Daily
| S3 | S2 | S1 | Price | |
|---|---|---|---|---|
| ProTrendLines | 384.9 | 437.5 | 455.4 | 465.6 |
| Change (%) | -17.33% | -6.04% | -2.19% | - |
| Change | -80.7 | -28.1 | -10.2 | - |
| Level | Intermediate | Major | Intermediate | - |
Pivot points can also be used to set your price objectives. Here is the price situation in relation to pivot points:
| Pivot points | S3 | S2 | S1 | PP | R1 | R2 | R3 |
|---|---|---|---|---|---|---|---|
| Standard | 441.3 | 445.7 | 453.9 | 458.3 | 466.5 | 470.9 | 479.1 |
| Camarilla | 458.6 | 459.8 | 461.0 | 462.1 | 463.3 | 464.4 | 465.6 |
| Woodie | 443.2 | 446.7 | 455.8 | 459.3 | 468.4 | 471.9 | 481.0 |
| Fibonacci | 445.7 | 450.5 | 453.5 | 458.3 | 463.1 | 466.1 | 470.9 |
| Pivot points | S3 | S2 | S1 | PP | R1 | R2 | R3 |
|---|---|---|---|---|---|---|---|
| Standard | 438.8 | 444.4 | 453.3 | 458.9 | 467.8 | 473.4 | 482.3 |
| Camarilla | 458.1 | 459.4 | 460.8 | 462.1 | 463.4 | 464.8 | 466.1 |
| Woodie | 440.4 | 445.2 | 454.9 | 459.7 | 469.4 | 474.2 | 483.9 |
| Fibonacci | 444.4 | 450.0 | 453.4 | 458.9 | 464.5 | 467.9 | 473.4 |
| Pivot points | S3 | S2 | S1 | PP | R1 | R2 | R3 |
|---|---|---|---|---|---|---|---|
| Standard | 348.7 | 371.7 | 391.9 | 414.9 | 435.1 | 458.1 | 478.3 |
| Camarilla | 400.3 | 404.3 | 408.2 | 412.2 | 416.2 | 420.1 | 424.1 |
| Woodie | 347.4 | 371.0 | 390.6 | 414.2 | 433.8 | 457.4 | 477.0 |
| Fibonacci | 371.7 | 388.2 | 398.4 | 414.9 | 431.4 | 441.6 | 458.1 |
Numerical data
The following is the status of technical indicators and moving averages registered at the time this technical analysis was created:
| RSI (14): | 69.20 | |
| MACD (12,26,9): | 12.7000 | |
| Directional Movement: | 15.2 | |
| AROON (14): | 100.0 | |
| DEMA (21): | 460.7 | |
| Parabolic SAR (0,02-0,02-0,2): | 449.9 | |
| Elder Ray (13): | 12.5 | |
| Super Trend (3,10): | 441.9 | |
| Zig ZAG (10): | 465.1 | |
| VORTEX (21): | 1.3000 | |
| Stochastique (14,3,5): | 92.90 | |
| TEMA (21): | 467.9 | |
| Williams %R (14): | -1.40 | |
| Chande Momentum Oscillator (20): | 23.0 | |
| Repulse (5,40,3): | 1.4000 | |
| ROCnROLL: | 1 | |
| TRIX (15,9): | 0.4000 | |
| Courbe Coppock: | 18.80 |
| MA7: | 460.0 | |
| MA20: | 440.9 | |
| MA50: | 426.2 | |
| MA100: | 408.8 | |
| MAexp7: | 458.7 | |
| MAexp20: | 444.9 | |
| MAexp50: | 428.5 | |
| MAexp100: | 412.1 | |
| Price / MA7: | +1.22% | |
| Price / MA20: | +5.60% | |
| Price / MA50: | +9.24% | |
| Price / MA100: | +13.89% | |
| Price / MAexp7: | +1.50% | |
| Price / MAexp20: | +4.65% | |
| Price / MAexp50: | +8.66% | |
| Price / MAexp100: | +12.98% |
News
The latest news and videos published on MUENCH.RUECKVERS.VNA O.N. at the time of the analysis were as follows:
- EQS-Adhoc: Münchener Rückversicherungs-Gesellschaft Aktiengesellschaft in München: Munich Re posts quarterly result of €2.1bn
- EQS-Adhoc: Münchener Rückversicherungs-Gesellschaft Aktiengesellschaft in München: Munich Re plans dividend of €15 per share for 2023 and resolves share buy-back with volume of up to €1.5bn
- EQS-Adhoc: Münchener Rückversicherungs-Gesellschaft Aktiengesellschaft in München: Munich Re posts quarterly result of ca. €1.2bn and raises the guidance for 2023 to €4.5bn
- EQS-Adhoc: Münchener Rückversicherungs-Gesellschaft Aktiengesellschaft in München: Munich Re posts quarterly result of €1.3bn
- EQS-Adhoc: Münchener Rückversicherungs-Gesellschaft Aktiengesellschaft in München: Munich Re resolves share buy-back with a volume of up to €1bn
About author
Online


Add a comment
Comments
0 comments on the analysis MUENCH.RUECKVERS.VNA O.N. - Daily