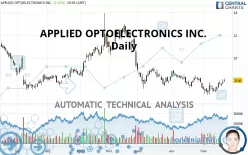
APPLIED OPTOELECTRONICS INC. - Daily - Technical analysis published on 05/24/2021 (GMT)
- 318
- 0
Click here for a new analysis!
- Timeframe : Daily
- - Analysis generated on
- Status : TARGET REACHED

Summary of the analysis

Additional analysis
Quotes
The APPLIED OPTOELECTRONICS INC. price is 8.06 USD. The price registered an increase of +2.16% on the session and was between 7.91 USD and 8.23 USD. This implies that the price is at +1.90% from its lowest and at -2.07% from its highest.The Central Gaps scanner detects a bullish opening. A small advantage for buyers in the very short term.
Bullish opening
Type : Bullish
Timeframe : Openning
So that you have an overall view of the price change, here is a table showing the variations over several periods:
Near a new HIGH record (1 month)
Type : Bullish
Timeframe : Weekly
Technical
A technical analysis in Daily of this APPLIED OPTOELECTRONICS INC. chart shows a bearish trend. The signals given by moving averages are at 71.43% bearish. This bearish trend could slow down given the slightly bullish signals currently being given by short-term moving averages. The Central Indicators scanner detects a bullish signal on moving averages that could impact this trend:
Bullish price crossover with adaptative moving average 20
Type : Bullish
Timeframe : Daily
Technical indicators are strongly bullish, suggesting that the price increase should continue.
Caution: the Central Indicators scanner currently detects an excess:
Williams %R indicator is overbought : over -20
Type : Neutral
Timeframe : Daily
Pivot points : price is over resistance 2
Type : Neutral
Timeframe : Weekly
Aroon indicator bullish trend
Type : Bullish
Timeframe : Daily
No signals are given by Central Patterns, a market scanner specialised in chart patterns, resistances and supports.
The Central Candlesticks scanner currently notes the presence of this pattern in Japanese candlesticks that could mark the end of the short-term trend currently underway:
White gravestone / inverted hammer
Type : Neutral
Timeframe : Daily
| S3 | S2 | S1 | Price | R1 | R2 | R3 | |
|---|---|---|---|---|---|---|---|
| ProTrendLines | 5.50 | 7.05 | 7.74 | 8.06 | 9.70 | 10.63 | 11.83 |
| Change (%) | -31.76% | -12.53% | -3.97% | - | +20.35% | +31.89% | +46.77% |
| Change | -2.56 | -1.01 | -0.32 | - | +1.64 | +2.57 | +3.77 |
| Level | Intermediate | Intermediate | Intermediate | - | Intermediate | Minor | Intermediate |
To determine price objectives, it is also possible to use the pivot points. Here is the price position in relation to pivot points:
| Pivot points | S3 | S2 | S1 | PP | R1 | R2 | R3 |
|---|---|---|---|---|---|---|---|
| Standard | 7.58 | 7.75 | 7.90 | 8.07 | 8.22 | 8.39 | 8.54 |
| Camarilla | 7.97 | 8.00 | 8.03 | 8.06 | 8.09 | 8.12 | 8.15 |
| Woodie | 7.58 | 7.75 | 7.90 | 8.07 | 8.22 | 8.39 | 8.54 |
| Fibonacci | 7.75 | 7.87 | 7.94 | 8.07 | 8.19 | 8.26 | 8.39 |
| Pivot points | S3 | S2 | S1 | PP | R1 | R2 | R3 |
|---|---|---|---|---|---|---|---|
| Standard | 6.47 | 6.76 | 7.11 | 7.40 | 7.75 | 8.04 | 8.39 |
| Camarilla | 7.29 | 7.35 | 7.41 | 7.47 | 7.53 | 7.59 | 7.65 |
| Woodie | 6.51 | 6.78 | 7.15 | 7.42 | 7.79 | 8.06 | 8.43 |
| Fibonacci | 6.76 | 7.00 | 7.15 | 7.40 | 7.64 | 7.79 | 8.04 |
| Pivot points | S3 | S2 | S1 | PP | R1 | R2 | R3 |
|---|---|---|---|---|---|---|---|
| Standard | 5.35 | 6.37 | 6.89 | 7.91 | 8.43 | 9.45 | 9.97 |
| Camarilla | 6.99 | 7.13 | 7.27 | 7.41 | 7.55 | 7.69 | 7.83 |
| Woodie | 5.10 | 6.25 | 6.64 | 7.79 | 8.18 | 9.33 | 9.72 |
| Fibonacci | 6.37 | 6.96 | 7.32 | 7.91 | 8.50 | 8.86 | 9.45 |
Numerical data
The following is the status of technical indicators and moving averages registered at the time this technical analysis was created:
| RSI (14): | 56.32 | |
| MACD (12,26,9): | -0.0800 | |
| Directional Movement: | 7.14 | |
| AROON (14): | 78.57 | |
| DEMA (21): | 7.54 | |
| Parabolic SAR (0,02-0,02-0,2): | 7.12 | |
| Elder Ray (13): | 0.38 | |
| Super Trend (3,10): | 8.16 | |
| Zig ZAG (10): | 8.06 | |
| VORTEX (21): | 1.0000 | |
| Stochastique (14,3,5): | 83.26 | |
| TEMA (21): | 7.72 | |
| Williams %R (14): | -11.49 | |
| Chande Momentum Oscillator (20): | 1.01 | |
| Repulse (5,40,3): | 2.7000 | |
| ROCnROLL: | -1 | |
| TRIX (15,9): | -0.3500 | |
| Courbe Coppock: | 2.69 |
| MA7: | 7.70 | |
| MA20: | 7.61 | |
| MA50: | 8.02 | |
| MA100: | 9.22 | |
| MAexp7: | 7.77 | |
| MAexp20: | 7.71 | |
| MAexp50: | 8.13 | |
| MAexp100: | 8.70 | |
| Price / MA7: | +4.68% | |
| Price / MA20: | +5.91% | |
| Price / MA50: | +0.50% | |
| Price / MA100: | -12.58% | |
| Price / MAexp7: | +3.73% | |
| Price / MAexp20: | +4.54% | |
| Price / MAexp50: | -0.86% | |
| Price / MAexp100: | -7.36% |
News
Don't forget to follow the news on APPLIED OPTOELECTRONICS INC.. At the time of publication of this analysis, the latest news was as follows:
-
 Applied Optoelectronics, Inc. - AAOI Stock Chart Technical Analysis for 07-09-2019
- Johnson Fistel, LLP Announces Investigations of LogMeIn, Inc., Stamps.com Inc. and Applied Optoelectronics, Inc.; Long Term Investors Encouraged to Contact Firm
- SHAREHOLDER ALERT: Pomerantz Law Firm Reminds Shareholders with Losses on their Investment in Applied Optoelectronics, Inc. of Class Action Lawsuit and Upcoming Deadline - AAOI
- SHAREHOLDER ALERT: Pomerantz Law Firm Reminds Shareholders with Losses on their Investment in Applied Optoelectronics, Inc. of Class Action Lawsuit and Upcoming Deadline - AAOI
- VITAL DEADLINE REMINDER: The Schall Law Firm Announces the Filing of a Class Action Lawsuit Against Applied Optoelectronics, Inc. and Encourages Investors with Losses in Excess of $250,000 to Contact the Firm
About author

Online


Add a comment
Comments
0 comments on the analysis APPLIED OPTOELECTRONICS INC. - Daily