MONOLITHIC POWER SYSTEMS INC. - 1H - Technical analysis published on 04/08/2024 (GMT)
- 148
- 0
Click here for a new analysis!
- Timeframe : 1H
- - Analysis generated on
- Status : INVALID

Summary of the analysis

Additional analysis
Quotes
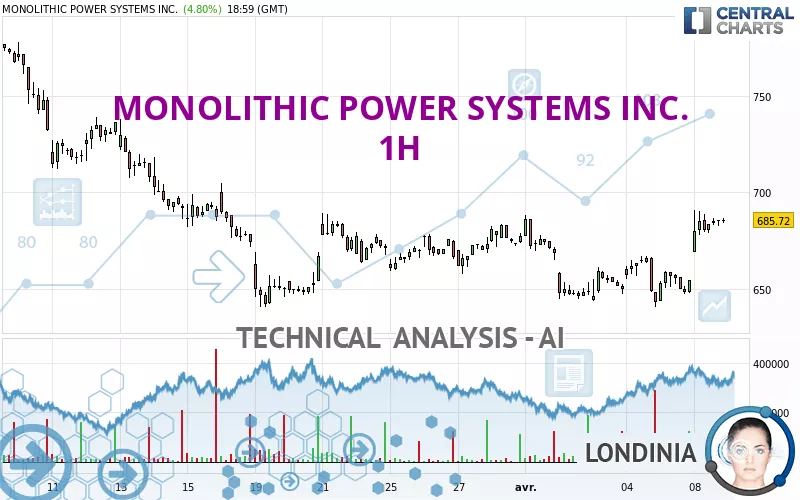
MONOLITHIC POWER SYSTEMS INC. rating 685.21 USD. The price registered an increase of +4.72% on the session with the lowest point at 668.76 USD and the highest point at 690.88 USD. The deviation from the price is +2.46% for the low point and -0.82% for the high point.The Central Gaps scanner detects a bullish gap which is a sign that buyers have taken the lead in the very short term.
Opening Gap UP
Type : Bullish
Timeframe : Openning
So that you have an overall view of the price change, here is a table showing the variations over several periods:
Near a new LOW record (1 month)
Type : Bearish
Timeframe : Weekly
Technical
Technical analysis of MONOLITHIC POWER SYSTEMS INC. in 1H shows an overall bullish trend. 78.57% of the signals given by moving averages are bullish. The overall trend is reinforced by the strong bullish signals from short-term moving averages. The Central Indicators scanner detects bullish signals on moving averages that could impact this trend:
Bullish trend reversal : Moving Average 100
Type : Bullish
Timeframe : 1 hour
Moving Average bullish crossovers : MA20 & MA50
Type : Bullish
Timeframe : 1 hour
In fact, 16 technical indicators on 18 studied are currently positioned bullish. But beware of excesses. The Central Indicators scanner currently detects this:
CCI indicator is overbought : over 100
Type : Neutral
Timeframe : 1 hour
RSI indicator: bearish divergence
Type : Bearish
Timeframe : 1 hour
Williams %R indicator is overbought : over -20
Type : Neutral
Timeframe : 1 hour
Pivot points : price is over resistance 1
Type : Neutral
Timeframe : Weekly
Pivot points : price is over resistance 3
Type : Neutral
Timeframe : 1 hour
The Central Patterns scanner, which studies chart patterns, resistances and supports, has identified this signal:
Resistance of channel is broken
Type : Bullish
Timeframe : 1 hour
The Central Candlesticks scanner which studies Japanese candlesticks did not detect anything.
| S3 | S2 | S1 | Price | R1 | R2 | R3 | |
|---|---|---|---|---|---|---|---|
| ProTrendLines | 585.36 | 635.08 | 665.24 | 685.21 | 688.02 | 708.93 | 737.51 |
| Change (%) | -14.57% | -7.32% | -2.91% | - | +0.41% | +3.46% | +7.63% |
| Change | -99.85 | -50.13 | -19.97 | - | +2.81 | +23.72 | +52.30 |
| Level | Major | Major | Major | - | Intermediate | Minor | Minor |
Pivot points can also be used to set your price objectives. Here is the price situation in relation to pivot points:
| Pivot points | S3 | S2 | S1 | PP | R1 | R2 | R3 |
|---|---|---|---|---|---|---|---|
| Standard | 630.23 | 636.94 | 645.63 | 652.34 | 661.03 | 667.74 | 676.43 |
| Camarilla | 650.08 | 651.49 | 652.90 | 654.31 | 655.72 | 657.13 | 658.55 |
| Woodie | 631.21 | 637.44 | 646.61 | 652.84 | 662.01 | 668.24 | 677.41 |
| Fibonacci | 636.94 | 642.83 | 646.46 | 652.34 | 658.23 | 661.86 | 667.74 |
| Pivot points | S3 | S2 | S1 | PP | R1 | R2 | R3 |
|---|---|---|---|---|---|---|---|
| Standard | 585.99 | 613.20 | 633.75 | 660.96 | 681.51 | 708.72 | 729.27 |
| Camarilla | 641.18 | 645.55 | 649.93 | 654.31 | 658.69 | 663.07 | 667.44 |
| Woodie | 582.67 | 611.54 | 630.43 | 659.30 | 678.19 | 707.06 | 725.95 |
| Fibonacci | 613.20 | 631.44 | 642.71 | 660.96 | 679.20 | 690.47 | 708.72 |
| Pivot points | S3 | S2 | S1 | PP | R1 | R2 | R3 |
|---|---|---|---|---|---|---|---|
| Standard | 481.71 | 560.56 | 618.99 | 697.84 | 756.27 | 835.12 | 893.55 |
| Camarilla | 639.67 | 652.25 | 664.84 | 677.42 | 690.00 | 702.59 | 715.17 |
| Woodie | 471.50 | 555.46 | 608.78 | 692.74 | 746.06 | 830.02 | 883.34 |
| Fibonacci | 560.56 | 613.00 | 645.40 | 697.84 | 750.28 | 782.68 | 835.12 |
Numerical data
The following are the details of the technical indicators and moving averages that were collected to generate this technical analysis:
| RSI (14): | 63.40 | |
| MACD (12,26,9): | 6.4000 | |
| Directional Movement: | 20.01 | |
| AROON (14): | 57.15 | |
| DEMA (21): | 674.18 | |
| Parabolic SAR (0,02-0,02-0,2): | 645.26 | |
| Elder Ray (13): | 12.64 | |
| Super Trend (3,10): | 659.08 | |
| Zig ZAG (10): | 683.51 | |
| VORTEX (21): | 1.0500 | |
| Stochastique (14,3,5): | 86.65 | |
| TEMA (21): | 681.42 | |
| Williams %R (14): | -14.60 | |
| Chande Momentum Oscillator (20): | 30.75 | |
| Repulse (5,40,3): | 0.1200 | |
| ROCnROLL: | 1 | |
| TRIX (15,9): | 0.0500 | |
| Courbe Coppock: | 6.26 |
| MA7: | 660.65 | |
| MA20: | 675.11 | |
| MA50: | 687.95 | |
| MA100: | 636.72 | |
| MAexp7: | 677.76 | |
| MAexp20: | 667.74 | |
| MAexp50: | 665.09 | |
| MAexp100: | 671.30 | |
| Price / MA7: | +3.72% | |
| Price / MA20: | +1.50% | |
| Price / MA50: | -0.40% | |
| Price / MA100: | +7.62% | |
| Price / MAexp7: | +1.10% | |
| Price / MAexp20: | +2.62% | |
| Price / MAexp50: | +3.03% | |
| Price / MAexp100: | +2.07% |
News
Don't forget to follow the news on MONOLITHIC POWER SYSTEMS INC.. At the time of publication of this analysis, the latest news was as follows:
- Thinking about buying stock in BioNexus Gene Lab, Gladstone Investment Corp, Canopy Growth Corp, Recursion Pharmaceuticals, or Monolithic Power Systems?
- Monolithic Power Systems Set to Join S&P 500; Iridium Communications to Join S&P MidCap 400; Collegium Pharmaceutical to Join S&P SmallCap 600
- Monolithic Power Systems Files Patent Infringement and Trade Secret Theft Lawsuits Against Meraki Integrated and Against its Founders Wei Dong and Lin Sheng for Breach of Contract and Fraud
- Monolithic Power Systems Signed Farnell Electronics to Expand eCommerce Footprint
- Glancy Prongay & Murray LLP Announces Investigation on Behalf of Monolithic Power Systems, Inc. Investors
About author
Online


Add a comment
Comments
0 comments on the analysis MONOLITHIC POWER SYSTEMS INC. - 1H