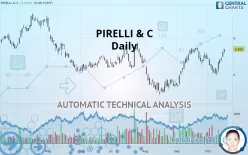
PIRELLI & C - Daily - Technical analysis published on 10/17/2019 (GMT)
- 215
- 0
- Who voted?
Click here for a new analysis!
- Timeframe : Daily
- - Analysis generated on
- Status : TARGET REACHED

Summary of the analysis

Additional analysis
Quotes
PIRELLI & C rating 5.694 EUR. The price registered an increase of +1.35% on the session with the lowest point at 5.582 EUR and the highest point at 5.698 EUR. The deviation from the price is +2.01% for the low point and -0.07% for the high point.The Central Gaps scanner detects a bullish gap which is a sign that buyers have taken the lead in the very short term.
Opening Gap UP
Type : Bullish
Timeframe : Openning
A study of price movements over other periods shows the following variations:
Near a new HIGH record (1 month)
Type : Bullish
Timeframe : Weekly
Technical
Technical analysis of PIRELLI & C in Daily shows a strongly overall bullish trend. The signals given by moving averages are 82.14% bullish. This strongly bullish trend seems to be running out of steam given the signals being given by short-term moving averages. The Central Indicators scanner does not detect any result on moving averages that would impact this trend.
In fact, 13 technical indicators on 18 studied are currently positioned bullish. But beware of excesses. The Central Indicators scanner currently detects this:
Williams %R indicator is overbought : over -20
Type : Neutral
Timeframe : Daily
Pivot points : price is over resistance 3
Type : Neutral
Timeframe : Daily
Price is back under the pivot point
Type : Bearish
Timeframe : Weekly
An analysis of the price chart with the Central Patterns scanner (detector of chart patterns and resistances and supports) shows several results that can have an impact on the price change:
Near resistance of channel
Type : Bearish
Timeframe : Daily
Horizontal resistance is broken
Type : Bullish
Timeframe : Daily
The presence of a bullish Japanese candlestick pattern detected by Central Candlesticks that could cause a very short term rebound was also detected:
Three white soldiers
Type : Bullish
Timeframe : Daily
| S3 | S2 | S1 | Price | R1 | R2 | R3 | |
|---|---|---|---|---|---|---|---|
| ProTrendLines | 4.673 | 5.106 | 5.372 | 5.694 | 5.804 | 6.105 | 6.406 |
| Change (%) | -17.93% | -10.33% | -5.66% | - | +1.93% | +7.22% | +12.50% |
| Change | -1.021 | -0.588 | -0.322 | - | +0.110 | +0.411 | +0.712 |
| Level | Intermediate | Intermediate | Intermediate | - | Intermediate | Minor | Minor |
To determine price objectives, it is also possible to use the pivot points. Here is the price position in relation to pivot points:
| Pivot points | S3 | S2 | S1 | PP | R1 | R2 | R3 |
|---|---|---|---|---|---|---|---|
| Standard | 5.252 | 5.304 | 5.366 | 5.418 | 5.480 | 5.532 | 5.594 |
| Camarilla | 5.397 | 5.407 | 5.418 | 5.428 | 5.438 | 5.449 | 5.459 |
| Woodie | 5.257 | 5.307 | 5.371 | 5.421 | 5.485 | 5.535 | 5.599 |
| Fibonacci | 5.304 | 5.348 | 5.375 | 5.418 | 5.462 | 5.489 | 5.532 |
| Pivot points | S3 | S2 | S1 | PP | R1 | R2 | R3 |
|---|---|---|---|---|---|---|---|
| Standard | 4.363 | 4.697 | 4.907 | 5.241 | 5.451 | 5.785 | 5.995 |
| Camarilla | 4.968 | 5.018 | 5.068 | 5.118 | 5.168 | 5.218 | 5.268 |
| Woodie | 4.302 | 4.666 | 4.846 | 5.210 | 5.390 | 5.754 | 5.934 |
| Fibonacci | 4.697 | 4.905 | 5.033 | 5.241 | 5.449 | 5.577 | 5.785 |
| Pivot points | S3 | S2 | S1 | PP | R1 | R2 | R3 |
|---|---|---|---|---|---|---|---|
| Standard | 3.716 | 4.181 | 4.805 | 5.270 | 5.894 | 6.359 | 6.983 |
| Camarilla | 5.129 | 5.228 | 5.328 | 5.428 | 5.528 | 5.628 | 5.728 |
| Woodie | 3.795 | 4.221 | 4.884 | 5.310 | 5.973 | 6.399 | 7.062 |
| Fibonacci | 4.181 | 4.597 | 4.854 | 5.270 | 5.686 | 5.943 | 6.359 |
Numerical data
The following is the status of technical indicators and moving averages registered at the time this technical analysis was created:
| RSI (14): | 62.49 | |
| MACD (12,26,9): | 0.0390 | |
| Directional Movement: | 11.830 | |
| AROON (14): | 28.571 | |
| DEMA (21): | 5.388 | |
| Parabolic SAR (0,02-0,02-0,2): | 5.028 | |
| Elder Ray (13): | 0.201 | |
| Super Trend (3,10): | 5.059 | |
| Zig ZAG (10): | 5.618 | |
| VORTEX (21): | 0.9480 | |
| Stochastique (14,3,5): | 80.74 | |
| TEMA (21): | 5.374 | |
| Williams %R (14): | -0.31 | |
| Chande Momentum Oscillator (20): | 0.078 | |
| Repulse (5,40,3): | 6.2620 | |
| ROCnROLL: | 1 | |
| TRIX (15,9): | 0.1050 | |
| Courbe Coppock: | 6.35 |
| MA7: | 5.292 | |
| MA20: | 5.384 | |
| MA50: | 5.108 | |
| MA100: | 5.218 | |
| MAexp7: | 5.383 | |
| MAexp20: | 5.331 | |
| MAexp50: | 5.270 | |
| MAexp100: | 5.330 | |
| Price / MA7: | +7.60% | |
| Price / MA20: | +5.76% | |
| Price / MA50: | +11.47% | |
| Price / MA100: | +9.12% | |
| Price / MAexp7: | +5.78% | |
| Price / MAexp20: | +6.81% | |
| Price / MAexp50: | +8.05% | |
| Price / MAexp100: | +6.83% |
About author

Online


Add a comment
Comments
0 comments on the analysis PIRELLI & C - Daily