MICROSTRATEGY INC. - 1H - Technical analysis published on 01/06/2025 (GMT)
- 117
- 0
Click here for a new analysis!
- Timeframe : 1H
- - Analysis generated on
- Status : INVALID
Summary of the analysis

Additional analysis
Quotes
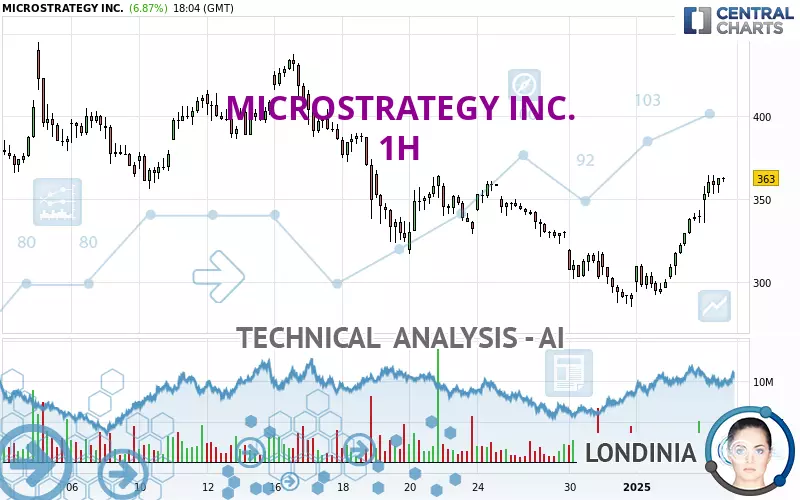
MICROSTRATEGY INC. rating 363.00 USD. On the day, this instrument gained +6.87% and was traded between 335.50 USD and 364.88 USD over the period. The price is currently at +8.20% from its lowest and -0.52% from its highest.The Central Gaps scanner detects the formation of a bullish gap marking the strong presence of buyers against sellers at the opening. This formed a quotation gap.
Opening Gap UP
Type : Bullish
Timeframe : Openning
A study of price movements over other periods shows the following variations:
New HIGH record (1st january)
Type : Bullish
Timeframe : Weekly
Technical
A technical analysis in 1H of this MICROSTRATEGY INC. chart shows a bullish trend. The signals returned by the moving averages are 64.29% bullish. This bullish trend is reinforced by the strong signals currently being given by short-term moving averages. The Central Indicators market scanner is currently detecting a bullish signal that could impact this trend:
Moving Average bullish crossovers : AMA20 & AMA50
Type : Bullish
Timeframe : 1 hour
An assessment of technical indicators shows a strong bullish signal.
Caution: the Central Indicators scanner currently detects an excess:
RSI indicator is overbought : over 70
Type : Neutral
Timeframe : 1 hour
CCI indicator is overbought : over 100
Type : Neutral
Timeframe : 1 hour
Williams %R indicator is overbought : over -20
Type : Neutral
Timeframe : 1 hour
Pivot points : price is over resistance 1
Type : Neutral
Timeframe : 1 hour
Pivot points : price is over resistance 1
Type : Neutral
Timeframe : Weekly
The Central Patterns scanner, which studies chart patterns, resistances and supports, has identified this signal:
Resistance of channel is broken
Type : Bullish
Timeframe : 1 hour
For a small rebound in the very short term, the Central Candlesticks scanner currently notes the presence of these bullish patterns in Japanese candlesticks:
Bullish harami
Type : Bullish
Timeframe : 1 hour
Bullish harami cross
Type : Bullish
Timeframe : 1 hour
| S3 | S2 | S1 | Price | R1 | R2 | R3 | |
|---|---|---|---|---|---|---|---|
| ProTrendLines | 301.75 | 326.70 | 354.66 | 363.00 | 386.42 | 410.32 | 444.95 |
| Change (%) | -16.87% | -10.00% | -2.30% | - | +6.45% | +13.04% | +22.58% |
| Change | -61.25 | -36.30 | -8.34 | - | +23.42 | +47.32 | +81.95 |
| Level | Minor | Major | Intermediate | - | Minor | Major | Intermediate |
Pivot points can also be used to set your price objectives. Here is the price situation in relation to pivot points:
| Pivot points | S3 | S2 | S1 | PP | R1 | R2 | R3 |
|---|---|---|---|---|---|---|---|
| Standard | 271.52 | 286.65 | 313.15 | 328.28 | 354.78 | 369.91 | 396.41 |
| Camarilla | 328.21 | 332.03 | 335.84 | 339.66 | 343.48 | 347.29 | 351.11 |
| Woodie | 277.22 | 289.49 | 318.85 | 331.12 | 360.48 | 372.75 | 402.11 |
| Fibonacci | 286.65 | 302.55 | 312.37 | 328.28 | 344.18 | 354.00 | 369.91 |
| Pivot points | S3 | S2 | S1 | PP | R1 | R2 | R3 |
|---|---|---|---|---|---|---|---|
| Standard | 243.59 | 264.30 | 301.98 | 322.69 | 360.37 | 381.08 | 418.76 |
| Camarilla | 323.60 | 328.96 | 334.31 | 339.66 | 345.01 | 350.37 | 355.72 |
| Woodie | 252.08 | 268.54 | 310.47 | 326.93 | 368.86 | 385.32 | 427.25 |
| Fibonacci | 264.30 | 286.61 | 300.39 | 322.69 | 345.00 | 358.78 | 381.08 |
| Pivot points | S3 | S2 | S1 | PP | R1 | R2 | R3 |
|---|---|---|---|---|---|---|---|
| Standard | 74.84 | 179.93 | 234.77 | 339.86 | 394.70 | 499.79 | 554.63 |
| Camarilla | 245.64 | 260.30 | 274.96 | 289.62 | 304.28 | 318.94 | 333.60 |
| Woodie | 49.73 | 167.37 | 209.66 | 327.30 | 369.59 | 487.23 | 529.52 |
| Fibonacci | 179.93 | 241.02 | 278.76 | 339.86 | 400.95 | 438.69 | 499.79 |
Numerical data
The following is the status of the technical indicators and moving averages at the time of publication of this technical analysis:
| RSI (14): | 71.23 | |
| MACD (12,26,9): | 11.2000 | |
| Directional Movement: | 25.78 | |
| AROON (14): | 78.57 | |
| DEMA (21): | 341.56 | |
| Parabolic SAR (0,02-0,02-0,2): | 337.61 | |
| Elder Ray (13): | 20.18 | |
| Super Trend (3,10): | 327.73 | |
| Zig ZAG (10): | 357.15 | |
| VORTEX (21): | 1.3000 | |
| Stochastique (14,3,5): | 91.50 | |
| TEMA (21): | 356.55 | |
| Williams %R (14): | -10.77 | |
| Chande Momentum Oscillator (20): | 61.53 | |
| Repulse (5,40,3): | 1.9800 | |
| ROCnROLL: | 1 | |
| TRIX (15,9): | 0.2100 | |
| Courbe Coppock: | 33.99 |
| MA7: | 323.04 | |
| MA20: | 356.85 | |
| MA50: | 339.46 | |
| MA100: | 248.21 | |
| MAexp7: | 348.77 | |
| MAexp20: | 330.73 | |
| MAexp50: | 329.43 | |
| MAexp100: | 342.53 | |
| Price / MA7: | +12.37% | |
| Price / MA20: | +1.72% | |
| Price / MA50: | +6.93% | |
| Price / MA100: | +46.25% | |
| Price / MAexp7: | +4.08% | |
| Price / MAexp20: | +9.76% | |
| Price / MAexp50: | +10.19% | |
| Price / MAexp100: | +5.98% |
News
Don't forget to follow the news on MICROSTRATEGY INC.. At the time of publication of this analysis, the latest news was as follows:
- MicroStrategy to Target a Capital Raise of Up to $2 Billion of Preferred Stock
-
 Coinbase, MicroStrategy and Riot Price Forecast: COIN, MSTR and RIOT Technical Analysis (12/31)
- MicroStrategy Completes $3,000,000,000 Offering of 0% Convertible Senior Notes Due 2029
- MicroStrategy Announces Pricing of Offering of 0% Convertible Senior Notes
- MicroStrategy Announces Proposed Private Offering of $1.75 Billion of Convertible Senior Notes
About author
Online


Add a comment
Comments
0 comments on the analysis MICROSTRATEGY INC. - 1H