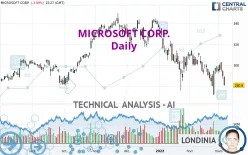
MICROSOFT CORP. - Daily - Technical analysis published on 03/07/2022 (GMT)
- 217
- 0
Click here for a new analysis!
- Timeframe : Daily
- - Analysis generated on
- Status : INVALID

Summary of the analysis

Additional analysis
Quotes
MICROSOFT CORP. rating 280.90 USD. The price registered a decrease of -3.09% on the session and was between 280.70 USD and 289.69 USD. This implies that the price is at +0.07% from its lowest and at -3.03% from its highest.The Central Gaps scanner detects a bearish opening. A small advantage for sellers in the very short term.
Bearish opening
Type : Bearish
Timeframe : Openning
A study of price movements over other periods shows the following variations:
Near a new LOW record (1st january)
Type : Bearish
Timeframe : Weekly
Near a new LOW record (1 month)
Type : Bearish
Timeframe : Weekly
Technical
Technical analysis of this Daily chart of MICROSOFT CORP. indicates that the overall trend is strongly bearish. The signals given by moving averages are 92.86% bearish. This strong bearish trend is confirmed by the strong signals currently being given by short-term moving averages. The Central Indicators market scanner is currently detecting a bearish signal that could impact this trend:
Bearish trend reversal : Moving Average 100
Type : Bearish
Timeframe : Daily
On the 18 technical indicators analysed, 5 are bullish, 5 are neutral and 8 are bearish. Caution: the Central Indicators scanner currently detects an excess:
CCI indicator is oversold : under -100
Type : Neutral
Timeframe : Daily
Pivot points : price is under support 1
Type : Neutral
Timeframe : Weekly
Pivot points : price is under support 3
Type : Neutral
Timeframe : Daily
MACD crosses DOWN its Moving Average
Type : Bearish
Timeframe : Daily
Aroon indicator bullish trend
Type : Bullish
Timeframe : Daily
Williams %R indicator is back under -50
Type : Bearish
Timeframe : Daily
The Central Patterns scanner, which studies chart patterns, resistances and supports, has identified these signals:
Near horizontal support
Type : Bullish
Timeframe : Daily
Near support of channel
Type : Bullish
Timeframe : Daily
Near support of triangle
Type : Bullish
Timeframe : Daily
No result was found by the Central Candlesticks scanner on Japanese candlesticks.
| S3 | S2 | S1 | Price | R1 | R2 | R3 | |
|---|---|---|---|---|---|---|---|
| ProTrendLines | 245.71 | 257.38 | 265.02 | 280.90 | 281.92 | 305.22 | 313.51 |
| Change (%) | -12.53% | -8.37% | -5.65% | - | +0.36% | +8.66% | +11.61% |
| Change | -35.19 | -23.52 | -15.88 | - | +1.02 | +24.32 | +32.61 |
| Level | Minor | Minor | Minor | - | Major | Intermediate | Intermediate |
Attention could also be paid to pivot points to set price objectives:
| Pivot points | S3 | S2 | S1 | PP | R1 | R2 | R3 |
|---|---|---|---|---|---|---|---|
| Standard | 277.64 | 282.41 | 286.13 | 290.90 | 294.62 | 299.39 | 303.11 |
| Camarilla | 287.53 | 288.30 | 289.08 | 289.86 | 290.64 | 291.42 | 292.20 |
| Woodie | 277.13 | 282.15 | 285.62 | 290.64 | 294.11 | 299.13 | 302.60 |
| Fibonacci | 282.41 | 285.65 | 287.65 | 290.90 | 294.14 | 296.14 | 299.39 |
| Pivot points | S3 | S2 | S1 | PP | R1 | R2 | R3 |
|---|---|---|---|---|---|---|---|
| Standard | 267.68 | 277.43 | 283.64 | 293.39 | 299.60 | 309.35 | 315.56 |
| Camarilla | 285.47 | 286.93 | 288.40 | 289.86 | 291.32 | 292.79 | 294.25 |
| Woodie | 265.92 | 276.55 | 281.88 | 292.51 | 297.84 | 308.47 | 313.80 |
| Fibonacci | 277.43 | 283.52 | 287.29 | 293.39 | 299.48 | 303.25 | 309.35 |
| Pivot points | S3 | S2 | S1 | PP | R1 | R2 | R3 |
|---|---|---|---|---|---|---|---|
| Standard | 232.43 | 251.98 | 275.38 | 294.93 | 318.33 | 337.88 | 361.28 |
| Camarilla | 286.98 | 290.92 | 294.85 | 298.79 | 302.73 | 306.66 | 310.60 |
| Woodie | 234.37 | 252.94 | 277.32 | 295.89 | 320.27 | 338.84 | 363.22 |
| Fibonacci | 251.98 | 268.38 | 278.52 | 294.93 | 311.33 | 321.47 | 337.88 |
Numerical data
The following is the status of the technical indicators and moving averages at the time of publication of this technical analysis:
| RSI (14): | 38.29 | |
| MACD (12,26,9): | -4.2900 | |
| Directional Movement: | -21.00 | |
| AROON (14): | 35.71 | |
| DEMA (21): | 289.32 | |
| Parabolic SAR (0,02-0,02-0,2): | 279.22 | |
| Elder Ray (13): | -7.88 | |
| Super Trend (3,10): | 312.08 | |
| Zig ZAG (10): | 281.44 | |
| VORTEX (21): | 0.8400 | |
| Stochastique (14,3,5): | 55.22 | |
| TEMA (21): | 289.75 | |
| Williams %R (14): | -68.35 | |
| Chande Momentum Oscillator (20): | -17.88 | |
| Repulse (5,40,3): | -4.6000 | |
| ROCnROLL: | 2 | |
| TRIX (15,9): | -0.2000 | |
| Courbe Coppock: | 4.89 |
| MA7: | 293.99 | |
| MA20: | 295.24 | |
| MA50: | 306.51 | |
| MA100: | 316.60 | |
| MAexp7: | 291.04 | |
| MAexp20: | 295.31 | |
| MAexp50: | 303.38 | |
| MAexp100: | 305.78 | |
| Price / MA7: | -4.45% | |
| Price / MA20: | -4.86% | |
| Price / MA50: | -8.36% | |
| Price / MA100: | -11.28% | |
| Price / MAexp7: | -3.48% | |
| Price / MAexp20: | -4.88% | |
| Price / MAexp50: | -7.41% | |
| Price / MAexp100: | -8.14% |
News
The latest news and videos published on MICROSOFT CORP. at the time of the analysis were as follows:
- Constellation Launches Sustainability Partnership With Microsoft Featuring 24/7/365 Real-Time Carbon-Free Energy Matching Solution
- Microsoft completes acquisition of Nuance, ushering in new era of outcomes-based AI
- MPP Global Announces Microsoft Azure Migration for Global Media Client Base
- Microsoft Executive Bobby Yerramilli-Rao Joins GlobalFoundries Board of Directors
- Leaders from AWS, Microsoft and Rivian Headline Innovation and Technology Programming at CERAWeek by S&P Global 2022
About author

Online


Add a comment
Comments
0 comments on the analysis MICROSOFT CORP. - Daily