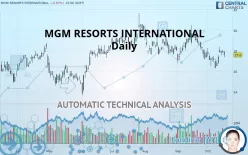
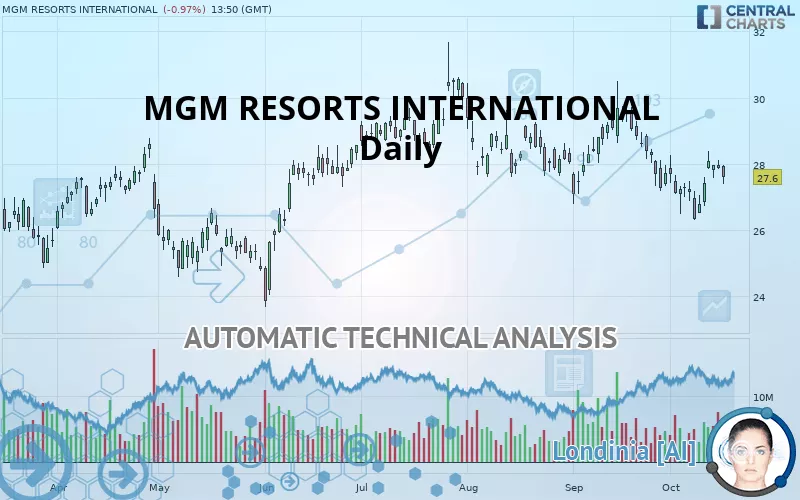
MGM RESORTS INTERNATIONAL - Daily - Technical analysis published on 10/16/2019 (GMT)
- 289
- 0
- Who voted?
Click here for a new analysis!
- Timeframe : Daily
- - Analysis generated on
- Status : INVALID
Summary of the analysis

Additional analysis
Quotes
The MGM RESORTS INTERNATIONAL rating is 27.60 USD. On the day, this instrument lost -0.97% and was between 27.40 USD and 27.97 USD. This implies that the price is at +0.73% from its lowest and at -1.32% from its highest.The Central Gaps scanner detects a bullish opening. A small advantage for buyers in the very short term.
Bullish opening
Type : Bullish
Timeframe : Openning
A study of price movements over other periods shows the following variations:
Near a new LOW record (1 month)
Type : Bearish
Timeframe : Weekly
Technical
A technical analysis in Daily of this MGM RESORTS INTERNATIONAL chart shows a bearish trend. 75% of the signals given by moving averages are bearish. The overall trend is reinforced by the strong bearish signals from short-term moving averages. The Central Indicators market scanner currently does not detect any result that concerns moving averages.
In fact, only 9 technical indicators out of 18 studied are currently positioned bullish. Caution: the Central Indicators scanner currently detects an excess:
Williams %R indicator is overbought : over -20
Type : Neutral
Timeframe : Daily
Ichimoku : price is under the cloud
Type : Bearish
Timeframe : Daily
Price is back over the pivot point
Type : Bullish
Timeframe : Weekly
Price is back under the pivot point
Type : Bearish
Timeframe : Daily
The Central Patterns scanner, which studies chart patterns, resistances and supports, has identified this signal:
Resistance of channel is broken
Type : Bullish
Timeframe : Daily
No result was found by the Central Candlesticks scanner on Japanese candlesticks.
| S3 | S2 | S1 | Price | R1 | R2 | R3 | |
|---|---|---|---|---|---|---|---|
| ProTrendLines | 25.00 | 26.50 | 27.09 | 27.60 | 28.27 | 29.71 | 30.55 |
| Change (%) | -9.42% | -3.99% | -1.85% | - | +2.43% | +7.64% | +10.69% |
| Change | -2.60 | -1.10 | -0.51 | - | +0.67 | +2.11 | +2.95 |
| Level | Minor | Intermediate | Major | - | Major | Major | Major |
Attention could also be paid to pivot points to set price objectives:
| Pivot points | S3 | S2 | S1 | PP | R1 | R2 | R3 |
|---|---|---|---|---|---|---|---|
| Standard | 27.52 | 27.69 | 27.78 | 27.95 | 28.04 | 28.21 | 28.30 |
| Camarilla | 27.80 | 27.82 | 27.85 | 27.87 | 27.89 | 27.92 | 27.94 |
| Woodie | 27.48 | 27.67 | 27.74 | 27.93 | 28.00 | 28.19 | 28.26 |
| Fibonacci | 27.69 | 27.79 | 27.85 | 27.95 | 28.05 | 28.11 | 28.21 |
| Pivot points | S3 | S2 | S1 | PP | R1 | R2 | R3 |
|---|---|---|---|---|---|---|---|
| Standard | 24.70 | 25.50 | 26.79 | 27.59 | 28.88 | 29.68 | 30.97 |
| Camarilla | 27.51 | 27.70 | 27.89 | 28.08 | 28.27 | 28.46 | 28.66 |
| Woodie | 24.95 | 25.62 | 27.04 | 27.71 | 29.13 | 29.80 | 31.22 |
| Fibonacci | 25.50 | 26.30 | 26.79 | 27.59 | 28.39 | 28.88 | 29.68 |
| Pivot points | S3 | S2 | S1 | PP | R1 | R2 | R3 |
|---|---|---|---|---|---|---|---|
| Standard | 22.26 | 24.46 | 26.09 | 28.30 | 29.92 | 32.13 | 33.76 |
| Camarilla | 26.67 | 27.02 | 27.37 | 27.72 | 28.07 | 28.42 | 28.77 |
| Woodie | 21.97 | 24.32 | 25.80 | 28.15 | 29.64 | 31.99 | 33.47 |
| Fibonacci | 24.46 | 25.93 | 26.83 | 28.30 | 29.76 | 30.66 | 32.13 |
Numerical data
The following is the status of technical indicators and moving averages registered at the time this technical analysis was created:
| RSI (14): | 49.06 | |
| MACD (12,26,9): | -0.1900 | |
| Directional Movement: | -2.85 | |
| AROON (14): | 21.43 | |
| DEMA (21): | 27.50 | |
| Parabolic SAR (0,02-0,02-0,2): | 26.56 | |
| Elder Ray (13): | 0.19 | |
| Super Trend (3,10): | 28.88 | |
| Zig ZAG (10): | 27.69 | |
| VORTEX (21): | 0.8100 | |
| Stochastique (14,3,5): | 71.23 | |
| TEMA (21): | 27.37 | |
| Williams %R (14): | -42.58 | |
| Chande Momentum Oscillator (20): | -0.21 | |
| Repulse (5,40,3): | -1.8400 | |
| ROCnROLL: | 2 | |
| TRIX (15,9): | -0.1400 | |
| Courbe Coppock: | 5.35 |
| MA7: | 27.42 | |
| MA20: | 27.74 | |
| MA50: | 28.11 | |
| MA100: | 28.04 | |
| MAexp7: | 27.58 | |
| MAexp20: | 27.75 | |
| MAexp50: | 27.99 | |
| MAexp100: | 27.86 | |
| Price / MA7: | +0.66% | |
| Price / MA20: | -0.50% | |
| Price / MA50: | -1.81% | |
| Price / MA100: | -1.57% | |
| Price / MAexp7: | +0.07% | |
| Price / MAexp20: | -0.54% | |
| Price / MAexp50: | -1.39% | |
| Price / MAexp100: | -0.93% |
News
Don"t forget to follow the news on MGM RESORTS INTERNATIONAL. At the time of publication of this analysis, the latest news was as follows:
- MGM Resorts International Announces Agreement To Monetize Bellagio Real Estate Assets
- MGM Resorts International Announces Agreement To Sell Circus Circus Las Vegas For $825 Million
- Taco Bell's "Steal a Base, Steal a Taco" Is Back -- And With More on the Line
- MGM Resorts International Announces Third Quarter 2019 Earnings Release Date
- MGM Resorts International Celebrates with the LGBTQ Community as a Sponsor of the 22nd Annual Las Vegas PRIDE Night Parade
About author

Online


Add a comment
Comments
0 comments on the analysis MGM RESORTS INTERNATIONAL - Daily