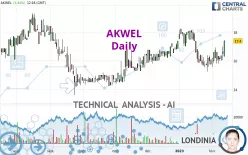
AKWEL - Daily - Technical analysis published on 02/13/2023 (GMT)
- 196
- 0
Click here for a new analysis!
- Timeframe : Daily
- - Analysis generated on
- Status : INVALID

Summary of the analysis

Additional analysis
Quotes
The AKWEL price is 17.40 EUR. The price has increased by +4.44% since the last closing and was between 16.30 EUR and 17.46 EUR. This implies that the price is at +6.75% from its lowest and at -0.34% from its highest.The Central Gaps scanner detects a bearish opening marking the presence of sellers ahead of buyers at the opening but not sufficiently marked to allow the price to register a quotation gap.
Bearish opening
Type : Bearish
Timeframe : Openning
So that you have an overall view of the price change, here is a table showing the variations over several periods:
Near a new HIGH record (1st january)
Type : Bullish
Timeframe : Weekly
Near a new HIGH record (1 month)
Type : Bullish
Timeframe : Weekly
Technical
Technical analysis of AKWEL in Daily shows a strongly overall bullish trend. The signals given by moving averages are 82.14% bullish. This strongly bullish trend seems to be running out of steam given the signals being given by short-term moving averages. The Central Indicators market scanner is currently detecting several bullish signals that could impact this trend:
Bullish trend reversal : adaptative moving average 50
Type : Bullish
Timeframe : Daily
Bullish trend reversal : adaptative moving average 100
Type : Bullish
Timeframe : Daily
Bullish price crossover with Moving Average 50
Type : Bullish
Timeframe : Daily
Technical indicators are strongly bullish, suggesting that the price increase should continue.
Caution: the Central Indicators scanner currently detects an excess:
CCI indicator is overbought : over 100
Type : Neutral
Timeframe : Daily
Williams %R indicator is overbought : over -20
Type : Neutral
Timeframe : Daily
Pivot points : price is over resistance 1
Type : Neutral
Timeframe : Daily
Pivot points : price is over resistance 1
Type : Neutral
Timeframe : Weekly
Ichimoku : price is over the cloud
Type : Bullish
Timeframe : Daily
The Central Patterns scanner, which studies chart patterns, resistances and supports, has identified this signal:
Horizontal resistance is broken
Type : Bullish
Timeframe : Daily
The Central Candlesticks scanner which studies Japanese candlesticks did not detect anything.
| S3 | S2 | S1 | Price | R1 | R2 | R3 | |
|---|---|---|---|---|---|---|---|
| ProTrendLines | 15.66 | 16.73 | 17.24 | 17.40 | 18.10 | 19.20 | 19.78 |
| Change (%) | -10.00% | -3.85% | -0.92% | - | +4.02% | +10.34% | +13.68% |
| Change | -1.74 | -0.67 | -0.16 | - | +0.70 | +1.80 | +2.38 |
| Level | Major | Intermediate | Intermediate | - | Major | Minor | Intermediate |
Attention could also be paid to pivot points to set price objectives:
| Pivot points | S3 | S2 | S1 | PP | R1 | R2 | R3 |
|---|---|---|---|---|---|---|---|
| Standard | 15.25 | 15.65 | 16.15 | 16.55 | 17.05 | 17.45 | 17.95 |
| Camarilla | 16.41 | 16.50 | 16.58 | 16.66 | 16.74 | 16.83 | 16.91 |
| Woodie | 15.31 | 15.68 | 16.21 | 16.58 | 17.11 | 17.48 | 18.01 |
| Fibonacci | 15.65 | 15.99 | 16.20 | 16.55 | 16.89 | 17.10 | 17.45 |
| Pivot points | S3 | S2 | S1 | PP | R1 | R2 | R3 |
|---|---|---|---|---|---|---|---|
| Standard | 14.85 | 15.33 | 15.99 | 16.47 | 17.13 | 17.61 | 18.27 |
| Camarilla | 16.35 | 16.45 | 16.56 | 16.66 | 16.77 | 16.87 | 16.97 |
| Woodie | 14.95 | 15.38 | 16.09 | 16.52 | 17.23 | 17.66 | 18.37 |
| Fibonacci | 15.33 | 15.76 | 16.03 | 16.47 | 16.90 | 17.17 | 17.61 |
| Pivot points | S3 | S2 | S1 | PP | R1 | R2 | R3 |
|---|---|---|---|---|---|---|---|
| Standard | 11.59 | 13.41 | 14.59 | 16.41 | 17.59 | 19.41 | 20.59 |
| Camarilla | 14.94 | 15.21 | 15.49 | 15.76 | 16.04 | 16.31 | 16.59 |
| Woodie | 11.26 | 13.25 | 14.26 | 16.25 | 17.26 | 19.25 | 20.26 |
| Fibonacci | 13.41 | 14.56 | 15.27 | 16.41 | 17.56 | 18.27 | 19.41 |
Numerical data
The following are the details of the technical indicators and moving averages that were collected to generate this technical analysis:
| RSI (14): | 61.51 | |
| MACD (12,26,9): | -0.0300 | |
| Directional Movement: | 10.88 | |
| AROON (14): | 78.57 | |
| DEMA (21): | 16.40 | |
| Parabolic SAR (0,02-0,02-0,2): | 15.63 | |
| Elder Ray (13): | 0.40 | |
| Super Trend (3,10): | 17.54 | |
| Zig ZAG (10): | 17.36 | |
| VORTEX (21): | 0.8900 | |
| Stochastique (14,3,5): | 82.03 | |
| TEMA (21): | 16.39 | |
| Williams %R (14): | -4.50 | |
| Chande Momentum Oscillator (20): | 1.66 | |
| Repulse (5,40,3): | 10.4200 | |
| ROCnROLL: | 1 | |
| TRIX (15,9): | -0.1600 | |
| Courbe Coppock: | 5.56 |
| MA7: | 16.49 | |
| MA20: | 16.18 | |
| MA50: | 16.75 | |
| MA100: | 15.93 | |
| MAexp7: | 16.60 | |
| MAexp20: | 16.49 | |
| MAexp50: | 16.50 | |
| MAexp100: | 16.43 | |
| Price / MA7: | +5.52% | |
| Price / MA20: | +7.54% | |
| Price / MA50: | +3.88% | |
| Price / MA100: | +9.23% | |
| Price / MAexp7: | +4.82% | |
| Price / MAexp20: | +5.52% | |
| Price / MAexp50: | +5.45% | |
| Price / MAexp100: | +5.90% |
News
The last news published on AKWEL at the time of the generation of this analysis was as follows:
- AKWEL: 2023 FINANCIAL COMMUNICATION CALENDAR
- AKWEL: PUBLICATION OF RESULTS FOR THE 1st HALF OF 2022
- AKWEL: STABLE TURNOVER FIGURES FOR THE 1st HALF OF 2022
- Akwel: Turnover Increases 26% in the First Half of 2021
- AKWEL : 2021 Financial Communication Calendar
About author
Online


Add a comment
Comments
0 comments on the analysis AKWEL - Daily