| Open: | - |
| Change: | - |
| Volume: | - |
| Low: | - |
| High: | - |
| High / Low range: | - |
| Type: | Stocks |
| Ticker: | APAM |
| ISIN: | LU0569974404 |
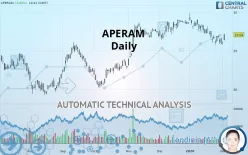
APERAM - Daily - Technical analysis published on 02/04/2020 (GMT)
- 354
- 0
- 02/04/2020 - 10:59
- Who voted?
- Timeframe : Daily
- - Analysis generated on 02/04/2020 - 10:58
- Status : NEUTRAL

Summary of the analysis

Additional analysis
Quotes
APERAM rating 27.04 EUR. On the day, this instrument gained +3.80% and was traded between 26.35 EUR and 27.16 EUR over the period. The price is currently at +2.62% from its lowest and -0.44% from its highest.The Central Gaps scanner detects a bullish gap which is a sign that buyers have taken the lead in the very short term.
Opening Gap UP
Type : Bullish
Timeframe : Openning
So that you have an overall view of the price change, here is a table showing the variations over several periods:
Near a new LOW record (1st january)
Type : Bearish
Timeframe : Weekly
Near a new LOW record (1 month)
Type : Bearish
Timeframe : Weekly
Technical
A technical analysis in Daily of this APERAM chart shows a slightly bullish trend. 50% of the signals given by moving averages are bullish. Caution: the slightly bearish signals currently given by short-term moving averages indicate that this slightly bullish trend could be reversed. There is no crossing of moving average by the price or crossing of moving averages between themselves.
The technical indicators are generally neutral. They do not provide relevant information on the direction of future price movements.
Caution: the Central Indicators scanner currently detects an excess:
CCI indicator is oversold : under -100
Type : Neutral
Timeframe : Daily
RSI indicator: bullish divergence
Type : Bullish
Timeframe : Daily
Williams %R indicator is oversold : under -80
Type : Neutral
Timeframe : Daily
Williams %R indicator is overbought : over -20
Type : Neutral
Timeframe : Daily
Pivot points : price is over resistance 1
Type : Neutral
Timeframe : Weekly
Pivot points : price is over resistance 3
Type : Neutral
Timeframe : Daily
An analysis of the price chart with the Central Patterns scanner (detector of chart patterns and resistances and supports) shows several results that can have an impact on the price change:
Near resistance of channel
Type : Bearish
Timeframe : Daily
Horizontal resistance is broken
Type : Bullish
Timeframe : Daily
Central Candlesticks, the scanner specialised in Japanese candlesticks, detects a bullish signal that could support the hypothesis of a small rebound in the very short term:
Bullish harami
Type : Bullish
Timeframe : Daily
| S3 | S2 | S1 | Price | R1 | R2 | R3 | |
|---|---|---|---|---|---|---|---|
| ProTrendLines | 24.92 | 25.71 | 26.67 | 27.04 | 27.74 | 28.52 | 29.92 |
| Change (%) | -7.84% | -4.92% | -1.37% | - | +2.59% | +5.47% | +10.65% |
| Change | -2.12 | -1.33 | -0.37 | - | +0.70 | +1.48 | +2.88 |
| Level | Minor | Major | Major | - | Intermediate | Minor | Major |
Attention could also be paid to pivot points to set price objectives:
| Pivot points | S3 | S2 | S1 | PP | R1 | R2 | R3 |
|---|---|---|---|---|---|---|---|
| Standard | 25.36 | 25.55 | 25.80 | 25.99 | 26.24 | 26.43 | 26.68 |
| Camarilla | 25.93 | 25.97 | 26.01 | 26.05 | 26.09 | 26.13 | 26.17 |
| Woodie | 25.39 | 25.57 | 25.83 | 26.01 | 26.27 | 26.45 | 26.71 |
| Fibonacci | 25.55 | 25.72 | 25.82 | 25.99 | 26.16 | 26.26 | 26.43 |
| Pivot points | S3 | S2 | S1 | PP | R1 | R2 | R3 |
|---|---|---|---|---|---|---|---|
| Standard | 24.26 | 25.01 | 25.48 | 26.23 | 26.70 | 27.45 | 27.92 |
| Camarilla | 25.61 | 25.73 | 25.84 | 25.95 | 26.06 | 26.17 | 26.29 |
| Woodie | 24.12 | 24.94 | 25.34 | 26.16 | 26.56 | 27.38 | 27.78 |
| Fibonacci | 25.01 | 25.48 | 25.76 | 26.23 | 26.70 | 26.98 | 27.45 |
| Pivot points | S3 | S2 | S1 | PP | R1 | R2 | R3 |
|---|---|---|---|---|---|---|---|
| Standard | 20.41 | 23.08 | 24.52 | 27.19 | 28.63 | 31.30 | 32.74 |
| Camarilla | 24.82 | 25.20 | 25.57 | 25.95 | 26.33 | 26.70 | 27.08 |
| Woodie | 19.79 | 22.77 | 23.90 | 26.88 | 28.01 | 30.99 | 32.12 |
| Fibonacci | 23.08 | 24.65 | 25.62 | 27.19 | 28.76 | 29.73 | 31.30 |
Numerical data
The following is the status of the technical indicators and moving averages at the time of publication of this technical analysis:
| RSI (14): | 47.75 | |
| MACD (12,26,9): | -0.4200 | |
| Directional Movement: | -2.21 | |
| AROON (14): | -92.86 | |
| DEMA (21): | 26.55 | |
| Parabolic SAR (0,02-0,02-0,2): | 25.74 | |
| Elder Ray (13): | -0.05 | |
| Super Trend (3,10): | 28.08 | |
| Zig ZAG (10): | 27.05 | |
| VORTEX (21): | 0.8400 | |
| Stochastique (14,3,5): | 24.27 | |
| TEMA (21): | 26.10 | |
| Williams %R (14): | -46.28 | |
| Chande Momentum Oscillator (20): | -0.38 | |
| Repulse (5,40,3): | 2.0200 | |
| ROCnROLL: | 1 | |
| TRIX (15,9): | -0.1900 | |
| Courbe Coppock: | 10.54 |
| MA7: | 26.46 | |
| MA20: | 27.18 | |
| MA50: | 27.72 | |
| MA100: | 25.85 | |
| MAexp7: | 26.55 | |
| MAexp20: | 27.04 | |
| MAexp50: | 27.09 | |
| MAexp100: | 26.29 | |
| Price / MA7: | +2.19% | |
| Price / MA20: | -0.52% | |
| Price / MA50: | -2.45% | |
| Price / MA100: | +4.60% | |
| Price / MAexp7: | +1.85% | |
| Price / MAexp20: | -0% | |
| Price / MAexp50: | -0.18% | |
| Price / MAexp100: | +2.85% |
News
The latest news and videos published on APERAM at the time of the analysis were as follows:
- 12/16/2019 - 06:01 Aperam S.A.: Aperam announces its 2030 environmental objectives and ambition to be carbon neutral in its European operations by 2050, contributing to the European Commission's Green Deal
- 12/05/2019 - 17:00 Aperam S.A.: Aperam announces its financial calendar for 2020
- 11/06/2019 - 06:00 Aperam S.A.: Third quarter 2019 results: Solid free cash flow despite a seasonal trough and challenging market conditions
- 10/25/2019 - 16:00 Aperam S.A.: Shareholding notifications with reference to Transparency Law
- 10/01/2019 - 16:00 Aperam S.A.: Announces Intention Redeem Convertible and/or Exchangeable Bonds
About author

Online


Add a comment
Comments
0 comments on the analysis APERAM - Daily