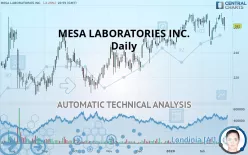
MESA LABORATORIES INC. - Daily - Technical analysis published on 02/26/2020 (GMT)
- 272
- 0
- Who voted?
Click here for a new analysis!
- Timeframe : Daily
- - Analysis generated on
- Status : INVALID

Summary of the analysis

Additional analysis
Quotes
The MESA LABORATORIES INC. price is 261.00 USD. The price registered a decrease of -2.25% on the session and was between 257.60 USD and 268.26 USD. This implies that the price is at +1.32% from its lowest and at -2.71% from its highest.A bullish gap was detected at the opening by the Central Gaps scanner. There are a lot of buyers and they have the upper hand in the very short term.
Opening Gap UP
Type : Bullish
Timeframe : Openning
So that you have an overall view of the price change, here is a table showing the variations over several periods:
Near a new HIGH record (5 years)
Type : Bullish
Timeframe : Weekly
Near a new HIGH record (1 year)
Type : Bullish
Timeframe : Weekly
Near a new HIGH record (1st january)
Type : Bullish
Timeframe : Weekly
Near a new HIGH record (1 month)
Type : Bullish
Timeframe : Weekly
Technical
Technical analysis of MESA LABORATORIES INC. in Daily shows an overall bullish trend. 71.43% of the signals given by moving averages are bullish. Caution: the neutral signals currently given by the short-term moving averages indicate that this bullish trend is showing signs of running out of steam. The Central Indicators market scanner currently does not detect any result that concerns moving averages.
In fact, of the 18 technical indicators analysed by Central Analyzer, 5 are bullish, 8 are neutral and 5 are bearish. Caution: the Central Indicators scanner currently detects an excess:
Williams %R indicator is overbought : over -20
Type : Neutral
Timeframe : Daily
Pivot points : price is under support 1
Type : Neutral
Timeframe : Daily
Pivot points : price is under support 1
Type : Neutral
Timeframe : Weekly
Price is back over the pivot point
Type : Bullish
Timeframe : Daily
Price is back over the pivot point
Type : Bullish
Timeframe : Weekly
Central Patterns, the scanner specializing in chart patterns, did not identify any signals.
The Central Candlesticks scanner, specialised in Japanese candlesticks, did not identify any signals.
| S3 | S2 | S1 | Price | R1 | |
|---|---|---|---|---|---|
| ProTrendLines | 213.21 | 222.61 | 260.00 | 261.00 | 270.17 |
| Change (%) | -18.31% | -14.71% | -0.38% | - | +3.51% |
| Change | -47.79 | -38.39 | -1.00 | - | +9.17 |
| Level | Intermediate | Major | Major | - | Major |
To determine price objectives, it is also possible to use the pivot points. Here is the price position in relation to pivot points:
| Pivot points | S3 | S2 | S1 | PP | R1 | R2 | R3 |
|---|---|---|---|---|---|---|---|
| Standard | 257.43 | 259.50 | 263.25 | 265.33 | 269.08 | 271.15 | 274.90 |
| Camarilla | 265.40 | 265.93 | 266.47 | 267.00 | 267.53 | 268.07 | 268.60 |
| Woodie | 258.26 | 259.92 | 264.09 | 265.74 | 269.91 | 271.57 | 275.74 |
| Fibonacci | 259.50 | 261.73 | 263.10 | 265.33 | 267.55 | 268.93 | 271.15 |
| Pivot points | S3 | S2 | S1 | PP | R1 | R2 | R3 |
|---|---|---|---|---|---|---|---|
| Standard | 250.81 | 255.33 | 262.41 | 266.93 | 274.01 | 278.53 | 285.61 |
| Camarilla | 266.29 | 267.35 | 268.42 | 269.48 | 270.54 | 271.61 | 272.67 |
| Woodie | 252.08 | 255.97 | 263.68 | 267.57 | 275.28 | 279.17 | 286.88 |
| Fibonacci | 255.33 | 259.77 | 262.50 | 266.93 | 271.37 | 274.10 | 278.53 |
| Pivot points | S3 | S2 | S1 | PP | R1 | R2 | R3 |
|---|---|---|---|---|---|---|---|
| Standard | 218.38 | 230.66 | 246.55 | 258.83 | 274.72 | 287.00 | 302.89 |
| Camarilla | 254.69 | 257.28 | 259.86 | 262.44 | 265.02 | 267.60 | 270.19 |
| Woodie | 220.19 | 231.56 | 248.36 | 259.73 | 276.53 | 287.90 | 304.70 |
| Fibonacci | 230.66 | 241.42 | 248.07 | 258.83 | 269.59 | 276.24 | 287.00 |
Numerical data
The following is the status of technical indicators and moving averages registered at the time this technical analysis was created:
| RSI (14): | 48.77 | |
| MACD (12,26,9): | 1.9300 | |
| Directional Movement: | -3.67 | |
| AROON (14): | 50.00 | |
| DEMA (21): | 266.03 | |
| Parabolic SAR (0,02-0,02-0,2): | 252.31 | |
| Elder Ray (13): | -1.11 | |
| Super Trend (3,10): | 270.95 | |
| Zig ZAG (10): | 261.00 | |
| VORTEX (21): | 0.9200 | |
| Stochastique (14,3,5): | 77.72 | |
| TEMA (21): | 264.78 | |
| Williams %R (14): | -41.38 | |
| Chande Momentum Oscillator (20): | -9.25 | |
| Repulse (5,40,3): | -0.1000 | |
| ROCnROLL: | -1 | |
| TRIX (15,9): | 0.1100 | |
| Courbe Coppock: | 0.40 |
| MA7: | 265.80 | |
| MA20: | 263.57 | |
| MA50: | 258.03 | |
| MA100: | 244.28 | |
| MAexp7: | 264.74 | |
| MAexp20: | 263.19 | |
| MAexp50: | 257.41 | |
| MAexp100: | 249.50 | |
| Price / MA7: | -1.81% | |
| Price / MA20: | -0.98% | |
| Price / MA50: | +1.15% | |
| Price / MA100: | +6.84% | |
| Price / MAexp7: | -1.41% | |
| Price / MAexp20: | -0.83% | |
| Price / MAexp50: | +1.39% | |
| Price / MAexp100: | +4.61% |
News
The last news published on MESA LABORATORIES INC. at the time of the generation of this analysis was as follows:
- Analysis: Positioning to Benefit within Mesa Laboratories, World Acceptance, Mammoth Energy Services, Yintech Investment, Stamps, and Vera Bradley — Research Highlights Growth, Revenue, and Consolidated Results
- Factors of Influence in 2018, Key Indicators and Opportunity within Antero Midstream, Generac Holdings, Town Sports International, Mesa Laboratories, Ultrapar Participacoes, and United Microelectronics — New Research Emphasizes Economic Growth
-
 Mesa Laboratories
- Mesa Labs Reports Record Third Quarter Revenues and Adjusted Net Income
- Mesa Labs Declares Quarterly Dividend
About author

Online


Add a comment
Comments
0 comments on the analysis MESA LABORATORIES INC. - Daily