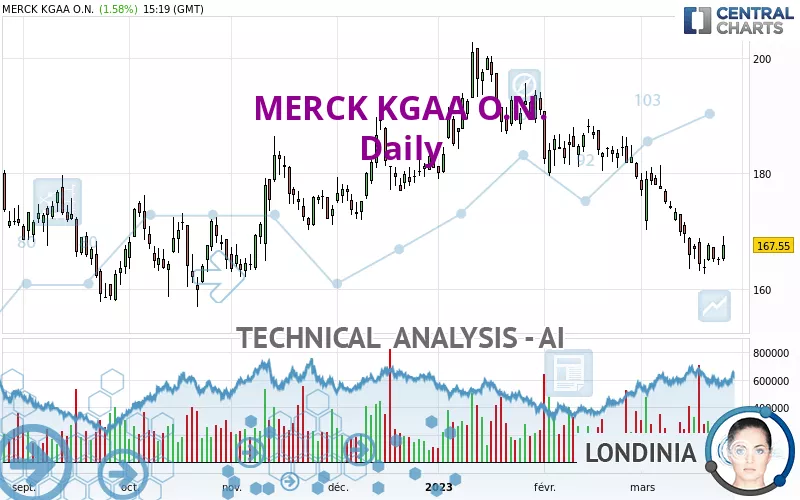
MERCK KGAA O.N. - Daily - Technical analysis published on 03/24/2023 (GMT)
- 222
- 0
Click here for a new analysis!
- Timeframe : Daily
- - Analysis generated on
- Status : LEVEL MAINTAINED

Summary of the analysis

Additional analysis
Quotes
The MERCK KGAA O.N. price is 167.55 EUR. The price has increased by +1.58% since the last closing with the lowest point at 164.70 EUR and the highest point at 169.10 EUR. The deviation from the price is +1.73% for the low point and -0.92% for the high point.The Central Gaps scanner detects a bullish opening marking the presence of buyers ahead of sellers at the opening but not sufficiently marked to allow the price to register a quotation gap.
Bullish opening
Type : Bullish
Timeframe : Openning
So that you have an overall view of the price change, here is a table showing the variations over several periods:
Near a new LOW record (1st january)
Type : Bearish
Timeframe : Weekly
Near a new LOW record (1 month)
Type : Bearish
Timeframe : Weekly
Technical
Technical analysis of this Daily chart of MERCK KGAA O.N. indicates that the overall trend is bearish. 78.57% of the signals given by moving averages are bearish. The overall trend is reinforced by the strong bearish signals from short-term moving averages. The Central Indicators scanner does not detect any result on moving averages that would impact this trend.
In fact, Central Analyzer took into account 18 technical indicators and the result was as follows: 6 are bullish, 4 are neutral and 8 are bearish. Other results related to technical indicators were also found by the Central Indicators scanner:
Pivot points : price is over resistance 3
Type : Neutral
Timeframe : Daily
Price is back over the pivot point
Type : Bullish
Timeframe : Weekly
An analysis of the price chart with the Central Patterns scanner (detector of chart patterns and resistances and supports) shows a result that can have an impact on the price change:
Near support of triangle
Type : Bullish
Timeframe : Daily
The Central Candlesticks scanner, specialised in Japanese candlesticks, did not identify any signals.
| S3 | S2 | S1 | Price | R1 | R2 | R3 | |
|---|---|---|---|---|---|---|---|
| ProTrendLines | 121.56 | 156.10 | 165.30 | 167.55 | 176.76 | 187.80 | 201.10 |
| Change (%) | -27.45% | -6.83% | -1.34% | - | +5.50% | +12.09% | +20.02% |
| Change | -45.99 | -11.45 | -2.25 | - | +9.21 | +20.25 | +33.55 |
| Level | Intermediate | Major | Intermediate | - | Intermediate | Major | Major |
Pivot points can also be used to set your price objectives. Here is the price situation in relation to pivot points:
| Pivot points | S3 | S2 | S1 | PP | R1 | R2 | R3 |
|---|---|---|---|---|---|---|---|
| Standard | 162.93 | 163.52 | 164.23 | 164.82 | 165.53 | 166.12 | 166.83 |
| Camarilla | 164.59 | 164.71 | 164.83 | 164.95 | 165.07 | 165.19 | 165.31 |
| Woodie | 163.00 | 163.55 | 164.30 | 164.85 | 165.60 | 166.15 | 166.90 |
| Fibonacci | 163.52 | 164.01 | 164.32 | 164.82 | 165.31 | 165.62 | 166.12 |
| Pivot points | S3 | S2 | S1 | PP | R1 | R2 | R3 |
|---|---|---|---|---|---|---|---|
| Standard | 150.63 | 156.82 | 160.58 | 166.77 | 170.53 | 176.72 | 180.48 |
| Camarilla | 161.61 | 162.53 | 163.44 | 164.35 | 165.26 | 166.17 | 167.09 |
| Woodie | 149.43 | 156.21 | 159.38 | 166.16 | 169.33 | 176.11 | 179.28 |
| Fibonacci | 156.82 | 160.62 | 162.97 | 166.77 | 170.57 | 172.92 | 176.72 |
| Pivot points | S3 | S2 | S1 | PP | R1 | R2 | R3 |
|---|---|---|---|---|---|---|---|
| Standard | 163.35 | 171.15 | 175.25 | 183.05 | 187.15 | 194.95 | 199.05 |
| Camarilla | 176.08 | 177.17 | 178.26 | 179.35 | 180.44 | 181.53 | 182.62 |
| Woodie | 161.50 | 170.23 | 173.40 | 182.13 | 185.30 | 194.03 | 197.20 |
| Fibonacci | 171.15 | 175.70 | 178.50 | 183.05 | 187.60 | 190.40 | 194.95 |
Numerical data
The following is the status of the technical indicators and moving averages at the time of publication of this technical analysis:
| RSI (14): | 37.99 | |
| MACD (12,26,9): | -4.7100 | |
| Directional Movement: | -14.14 | |
| AROON (14): | -64.29 | |
| DEMA (21): | 165.17 | |
| Parabolic SAR (0,02-0,02-0,2): | 172.29 | |
| Elder Ray (13): | -1.87 | |
| Super Trend (3,10): | 175.18 | |
| Zig ZAG (10): | 167.55 | |
| VORTEX (21): | 0.7300 | |
| Stochastique (14,3,5): | 17.85 | |
| TEMA (21): | 163.13 | |
| Williams %R (14): | -73.23 | |
| Chande Momentum Oscillator (20): | -7.55 | |
| Repulse (5,40,3): | 0.8300 | |
| ROCnROLL: | 2 | |
| TRIX (15,9): | -0.3700 | |
| Courbe Coppock: | 13.86 |
| MA7: | 165.71 | |
| MA20: | 172.01 | |
| MA50: | 181.33 | |
| MA100: | 180.61 | |
| MAexp7: | 166.70 | |
| MAexp20: | 171.31 | |
| MAexp50: | 177.10 | |
| MAexp100: | 178.30 | |
| Price / MA7: | +1.11% | |
| Price / MA20: | -2.59% | |
| Price / MA50: | -7.60% | |
| Price / MA100: | -7.23% | |
| Price / MAexp7: | +0.51% | |
| Price / MAexp20: | -2.19% | |
| Price / MAexp50: | -5.39% | |
| Price / MAexp100: | -6.03% |
News
The latest news and videos published on MERCK KGAA O.N. at the time of the analysis were as follows:
- DGAP-Adhoc: Merck KGaA raises forecast for full year 2021
- Merck and BioMed X Institute Extend Collaboration to Continue Novel Research in Oncology and Autoimmunity
- DGAP-Adhoc: Merck KGaA raises forecast for full year 2021
- Merck KGaA, Darmstadt, Germany, Reports Topline Data for Bintrafusp Alfa as Second-Line Monotherapy Treatment in Biliary Tract Cancer
- DGAP-Adhoc: Merck KGaA: Merck KGaA to discontinue bintrafusp alfa clinical trial (INTR@PID Lung 037)
About author
Online


Add a comment
Comments
0 comments on the analysis MERCK KGAA O.N. - Daily