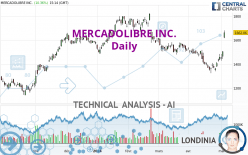
MERCADOLIBRE INC. - Daily - Technical analysis published on 05/03/2024 (GMT)
- 73
- 0
- Timeframe : Daily
- - Analysis generated on
- Status : IN PROGRESS...

Summary of the analysis

Additional analysis
Quotes
The MERCADOLIBRE INC. price is 1,662.06 USD. The price registered an increase of +10.36% on the session and was traded between 1,617.00 USD and 1,680.00 USD over the period. The price is currently at +2.79% from its lowest and -1.07% from its highest.A bullish gap was detected at the opening by the Central Gaps scanner. There are a lot of buyers and they have the upper hand in the very short term.
Opening Gap UP
Type : Bullish
Timeframe : Openning
A study of price movements over other periods shows the following variations:
New HIGH record (1 month)
Type : Bullish
Timeframe : Weekly
Technical
Technical analysis of MERCADOLIBRE INC. in Daily shows an overall bullish trend. The signals returned by the moving averages are 64.29% bullish. This bullish trend is reinforced by the strong signals currently being given by short-term moving averages. An assessment of moving averages reveals several bullish signals that could impact this trend:
Bullish trend reversal : Moving Average 20
Type : Bullish
Timeframe : Daily
Bullish trend reversal : adaptative moving average 50
Type : Bullish
Timeframe : Daily
Bullish price crossover with Moving Average 100
Type : Bullish
Timeframe : Daily
Bullish price crossover with adaptative moving average 100
Type : Bullish
Timeframe : Daily
An assessment of technical indicators shows a strong bullish signal.
Caution: the Central Indicators scanner currently detects an excess:
RSI indicator is overbought : over 70
Type : Neutral
Timeframe : Daily
CCI indicator is overbought : over 100
Type : Neutral
Timeframe : Daily
Williams %R indicator is overbought : over -20
Type : Neutral
Timeframe : Daily
Pivot points : price is over resistance 3
Type : Neutral
Timeframe : Daily
Pivot points : price is over resistance 3
Type : Neutral
Timeframe : Weekly
Aroon indicator bullish trend
Type : Bullish
Timeframe : Daily
Ichimoku : price is over the cloud
Type : Bullish
Timeframe : Daily
MACD indicator is back over 0
Type : Bullish
Timeframe : Daily
Ichimoku - Bullish crossover : Tenkan & Kijun
Type : Bullish
Timeframe : Daily
The Central Patterns scanner, which studies chart patterns, resistances and supports, has identified these signals:
Horizontal resistance is broken
Type : Bullish
Timeframe : Daily
Resistance of channel is broken
Type : Bullish
Timeframe : Daily
Central Candlesticks, the scanner specialised in Japanese candlesticks, detects a bullish signal that could support the hypothesis of a small rebound in the very short term:
Upside gap
Type : Bullish
Timeframe : Daily
| S3 | S2 | S1 | Price | R1 | R2 | |
|---|---|---|---|---|---|---|
| ProTrendLines | 1,502.93 | 1,571.08 | 1,623.01 | 1,662.06 | 1,817.98 | 1,984.34 |
| Change (%) | -9.57% | -5.47% | -2.35% | - | +9.38% | +19.39% |
| Change | -159.13 | -90.98 | -39.05 | - | +155.92 | +322.28 |
| Level | Major | Intermediate | Intermediate | - | Major | Major |
Pivot points can also be used to set your price objectives. Here is the price situation in relation to pivot points:
| Pivot points | S3 | S2 | S1 | PP | R1 | R2 | R3 |
|---|---|---|---|---|---|---|---|
| Standard | 1,402.49 | 1,423.30 | 1,464.64 | 1,485.45 | 1,526.79 | 1,547.60 | 1,588.94 |
| Camarilla | 1,488.90 | 1,494.60 | 1,500.29 | 1,505.99 | 1,511.69 | 1,517.38 | 1,523.08 |
| Woodie | 1,412.77 | 1,428.43 | 1,474.92 | 1,490.58 | 1,537.07 | 1,552.73 | 1,599.22 |
| Fibonacci | 1,423.30 | 1,447.04 | 1,461.71 | 1,485.45 | 1,509.19 | 1,523.86 | 1,547.60 |
| Pivot points | S3 | S2 | S1 | PP | R1 | R2 | R3 |
|---|---|---|---|---|---|---|---|
| Standard | 1,256.64 | 1,290.81 | 1,348.41 | 1,382.58 | 1,440.18 | 1,474.35 | 1,531.95 |
| Camarilla | 1,380.76 | 1,389.18 | 1,397.59 | 1,406.00 | 1,414.41 | 1,422.83 | 1,431.24 |
| Woodie | 1,268.35 | 1,296.67 | 1,360.12 | 1,388.44 | 1,451.89 | 1,480.21 | 1,543.66 |
| Fibonacci | 1,290.81 | 1,325.87 | 1,347.53 | 1,382.58 | 1,417.64 | 1,439.30 | 1,474.35 |
| Pivot points | S3 | S2 | S1 | PP | R1 | R2 | R3 |
|---|---|---|---|---|---|---|---|
| Standard | 1,126.14 | 1,225.57 | 1,342.13 | 1,441.56 | 1,558.12 | 1,657.55 | 1,774.11 |
| Camarilla | 1,399.30 | 1,419.10 | 1,438.90 | 1,458.70 | 1,478.50 | 1,498.30 | 1,518.10 |
| Woodie | 1,134.72 | 1,229.85 | 1,350.71 | 1,445.84 | 1,566.70 | 1,661.83 | 1,782.69 |
| Fibonacci | 1,225.57 | 1,308.08 | 1,359.05 | 1,441.56 | 1,524.07 | 1,575.04 | 1,657.55 |
Numerical data
The following is the status of the technical indicators and moving averages at the time of publication of this technical analysis:
| RSI (14): | 73.47 | |
| MACD (12,26,9): | 1.6000 | |
| Directional Movement: | 28.29 | |
| AROON (14): | 64.29 | |
| DEMA (21): | 1,452.70 | |
| Parabolic SAR (0,02-0,02-0,2): | 1,349.78 | |
| Elder Ray (13): | 178.97 | |
| Super Trend (3,10): | 1,476.11 | |
| Zig ZAG (10): | 1,672.64 | |
| VORTEX (21): | 0.9900 | |
| Stochastique (14,3,5): | 88.74 | |
| TEMA (21): | 1,487.88 | |
| Williams %R (14): | -2.07 | |
| Chande Momentum Oscillator (20): | 276.13 | |
| Repulse (5,40,3): | 8.2200 | |
| ROCnROLL: | 1 | |
| TRIX (15,9): | -0.2900 | |
| Courbe Coppock: | 5.13 |
| MA7: | 1,471.04 | |
| MA20: | 1,439.07 | |
| MA50: | 1,502.37 | |
| MA100: | 1,585.64 | |
| MAexp7: | 1,501.30 | |
| MAexp20: | 1,464.59 | |
| MAexp50: | 1,502.46 | |
| MAexp100: | 1,516.32 | |
| Price / MA7: | +12.99% | |
| Price / MA20: | +15.50% | |
| Price / MA50: | +10.63% | |
| Price / MA100: | +4.82% | |
| Price / MAexp7: | +10.71% | |
| Price / MAexp20: | +13.48% | |
| Price / MAexp50: | +10.62% | |
| Price / MAexp100: | +9.61% |
News
The latest news and videos published on MERCADOLIBRE INC. at the time of the analysis were as follows:
- Thinking about buying stock in MercadoLibre, Synopsys, ESGL Holdings, Soluna Holdings, or SenesTech?
- Thinking about trading options or stock in MercadoLibre, Tesla, Visa, Microsoft, or Bank of America?
- Thinking about buying stock in Party City, Lucid Group, AMC Entertainment, Delta Air Lines, or MercadoLibre?
- Thinking about trading options or stock in Unity Software, AstraZeneca, Amazon, MercadoLibre, or ASML Holding?
- Thinking about trading options or stock in Block, Mercadolibre, Futu, GameStop, or Regeneron Pharmaceuticals?
About author
Online


Add a comment
Comments
0 comments on the analysis MERCADOLIBRE INC. - Daily