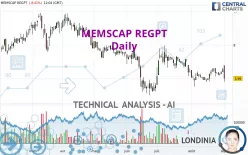
MEMSCAP REGPT - Daily - Technical analysis published on 09/02/2024 (GMT)
- 124
- 0
Click here for a new analysis!
- Timeframe : Daily
- - Analysis generated on
- Status : TARGET REACHED

Summary of the analysis

Additional analysis
Quotes
The MEMSCAP REGPT rating is 5.99 EUR. On the day, this instrument lost -8.41% and was between 5.80 EUR and 6.78 EUR. This implies that the price is at +3.28% from its lowest and at -11.65% from its highest.The Central Gaps scanner detects a bullish gap which is a sign that buyers have taken the lead in the very short term.
Opening Gap UP
Type : Bullish
Timeframe : Openning
A study of price movements over other periods shows the following variations:
New HIGH record (1 month)
Type : Bullish
Timeframe : Weekly
Technical
Technical analysis of this Daily chart of MEMSCAP REGPT indicates that the overall trend is strongly bearish. 82.14% of the signals given by moving averages are bearish. This strongly bearish trend is showing signs of slowing down given the slightly bearish signals given by short-term moving averages. The Central Indicators scanner detects bearish signals on moving averages that could impact this trend:
Bearish price crossover with Moving Average 20
Type : Bearish
Timeframe : Daily
Bearish price crossover with Moving Average 50
Type : Bearish
Timeframe : Daily
Bearish price crossover with adaptative moving average 20
Type : Bearish
Timeframe : Daily
The technical indicators are generally neutral. They do not provide relevant information on the direction of future price movements.
Caution: the Central Indicators scanner currently detects an excess:
RSI indicator: bearish divergence
Type : Bearish
Timeframe : Daily
Pivot points : price is under support 2
Type : Neutral
Timeframe : Weekly
Pivot points : price is under support 3
Type : Neutral
Timeframe : Daily
RSI indicator is back under 50
Type : Bearish
Timeframe : Daily
Parabolic SAR indicator bearish reversal
Type : Bearish
Timeframe : Daily
Ichimoku : price is under the cloud
Type : Bearish
Timeframe : Daily
Ichimoku - Bearish crossover : Tenkan & Kijun
Type : Bearish
Timeframe : Daily
Williams %R indicator is back under -50
Type : Bearish
Timeframe : Daily
Central Patterns, the market scanner focusing on chart patterns, resistances and supports found this result:
Near support of triangle
Type : Bullish
Timeframe : Daily
Central Candlesticks, the scanner specialised in Japanese candlesticks, detects these bearish signals that could support the hypothesis of a small drop in the very short term:
Black line without upper shadow
Type : Bearish
Timeframe : Daily
Long black line
Type : Bearish
Timeframe : Daily
Bearish engulfing lines
Type : Bearish
Timeframe : Daily
| S3 | S2 | S1 | Price | R1 | R2 | R3 | |
|---|---|---|---|---|---|---|---|
| ProTrendLines | 4.34 | 5.24 | 5.89 | 5.99 | 6.56 | 7.55 | 9.04 |
| Change (%) | -27.55% | -12.52% | -1.67% | - | +9.52% | +26.04% | +50.92% |
| Change | -1.65 | -0.75 | -0.10 | - | +0.57 | +1.56 | +3.05 |
| Level | Major | Major | Intermediate | - | Major | Intermediate | Minor |
To determine price objectives, it is also possible to use the pivot points. Here is the price position in relation to pivot points:
| Pivot points | S3 | S2 | S1 | PP | R1 | R2 | R3 |
|---|---|---|---|---|---|---|---|
| Standard | 6.18 | 6.29 | 6.41 | 6.52 | 6.64 | 6.75 | 6.87 |
| Camarilla | 6.48 | 6.50 | 6.52 | 6.54 | 6.56 | 6.58 | 6.60 |
| Woodie | 6.20 | 6.29 | 6.43 | 6.52 | 6.66 | 6.75 | 6.89 |
| Fibonacci | 6.29 | 6.38 | 6.43 | 6.52 | 6.61 | 6.66 | 6.75 |
| Pivot points | S3 | S2 | S1 | PP | R1 | R2 | R3 |
|---|---|---|---|---|---|---|---|
| Standard | 5.85 | 6.02 | 6.28 | 6.45 | 6.71 | 6.88 | 7.14 |
| Camarilla | 6.42 | 6.46 | 6.50 | 6.54 | 6.58 | 6.62 | 6.66 |
| Woodie | 5.90 | 6.04 | 6.33 | 6.47 | 6.76 | 6.90 | 7.19 |
| Fibonacci | 6.02 | 6.18 | 6.29 | 6.45 | 6.61 | 6.72 | 6.88 |
| Pivot points | S3 | S2 | S1 | PP | R1 | R2 | R3 |
|---|---|---|---|---|---|---|---|
| Standard | 4.70 | 5.10 | 5.82 | 6.22 | 6.94 | 7.34 | 8.06 |
| Camarilla | 6.23 | 6.34 | 6.44 | 6.54 | 6.64 | 6.75 | 6.85 |
| Woodie | 4.86 | 5.18 | 5.98 | 6.30 | 7.10 | 7.42 | 8.22 |
| Fibonacci | 5.10 | 5.53 | 5.79 | 6.22 | 6.65 | 6.91 | 7.34 |
Numerical data
The following is the status of the technical indicators and moving averages at the time of publication of this technical analysis:
| RSI (14): | 42.70 | |
| MACD (12,26,9): | -0.0500 | |
| Directional Movement: | -13.51 | |
| AROON (14): | 85.71 | |
| DEMA (21): | 6.22 | |
| Parabolic SAR (0,02-0,02-0,2): | 6.62 | |
| Elder Ray (13): | 0 | |
| Super Trend (3,10): | 6.81 | |
| Zig ZAG (10): | 6.04 | |
| VORTEX (21): | 0.9300 | |
| Stochastique (14,3,5): | 62.63 | |
| TEMA (21): | 6.28 | |
| Williams %R (14): | -80.61 | |
| Chande Momentum Oscillator (20): | 0.08 | |
| Repulse (5,40,3): | -13.1200 | |
| ROCnROLL: | 2 | |
| TRIX (15,9): | -0.2000 | |
| Courbe Coppock: | 8.87 |
| MA7: | 6.31 | |
| MA20: | 6.22 | |
| MA50: | 6.50 | |
| MA100: | 7.03 | |
| MAexp7: | 6.29 | |
| MAexp20: | 6.31 | |
| MAexp50: | 6.52 | |
| MAexp100: | 6.82 | |
| Price / MA7: | -5.07% | |
| Price / MA20: | -3.70% | |
| Price / MA50: | -7.85% | |
| Price / MA100: | -14.79% | |
| Price / MAexp7: | -4.77% | |
| Price / MAexp20: | -5.07% | |
| Price / MAexp50: | -8.13% | |
| Price / MAexp100: | -12.17% |
News
The latest news and videos published on MEMSCAP REGPT at the time of the analysis were as follows:
- MEMSCAP – Q2 2023: Profitability Rise Driven by Group's Business Growth
- MEMSCAP: Minutes of the Annual Ordinary and Extraordinary Shareholders’ Meeting of May 31, 2023
- MEGGITT Selects MEMSCAP for Engine Monitoring Systems
- MEMSCAP Unveils Its New Website
- MEMSCAP - Q1 2023 : Strong Profitable Growth as Targeted by the 4G Plan
About author

Online


Add a comment
Comments
0 comments on the analysis MEMSCAP REGPT - Daily