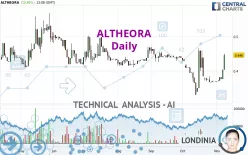
ALTHEORA - Daily - Technical analysis published on 11/08/2024 (GMT)
- 123
- 0
Click here for a new analysis!
- Timeframe : Daily
- - Analysis generated on
- Status : INVALID

Summary of the analysis

Additional analysis
Quotes
ALTHEORA rating 0.446 EUR. The price has increased by +10.40% since the last closing and was between 0.404 EUR and 0.450 EUR. This implies that the price is at +10.40% from its lowest and at -0.89% from its highest.A study of price movements over other periods shows the following variations:
Near a new HIGH record (1 month)
Type : Bullish
Timeframe : Weekly
Technical
A technical analysis in Daily of this ALTHEORA chart shows a slightly bullish trend. 53.57% of the signals given by moving averages are bullish. The overall trend could accelerate as strong bullish signals from short-term moving averages are expected. The Central Indicators scanner detects bullish signals on moving averages that could impact this trend:
Bullish trend reversal : Moving Average 20
Type : Bullish
Timeframe : Daily
Bullish trend reversal : adaptative moving average 20
Type : Bullish
Timeframe : Daily
Bullish trend reversal : adaptative moving average 50
Type : Bullish
Timeframe : Daily
Bullish price crossover with Moving Average 50
Type : Bullish
Timeframe : Daily
Bullish price crossover with Moving Average 100
Type : Bullish
Timeframe : Daily
Bullish price crossover with adaptative moving average 50
Type : Bullish
Timeframe : Daily
Bullish price crossover with adaptative moving average 100
Type : Bullish
Timeframe : Daily
In fact, 14 technical indicators on 18 studied are currently positioned bullish. Other results related to technical indicators were also found by the Central Indicators scanner:
Pivot points : price is over resistance 3
Type : Neutral
Timeframe : Daily
Pivot points : price is over resistance 3
Type : Neutral
Timeframe : Weekly
Ichimoku : price is over the cloud
Type : Bullish
Timeframe : Daily
Central Patterns, the market scanner focusing on chart patterns, resistances and supports found this result:
Resistance of channel is broken
Type : Bullish
Timeframe : Daily
The Central Candlesticks scanner which studies Japanese candlesticks did not detect anything.
| S3 | S2 | S1 | Price | R1 | R2 | R3 | |
|---|---|---|---|---|---|---|---|
| ProTrendLines | 0.332 | 0.370 | 0.416 | 0.446 | 0.467 | 0.530 | 0.690 |
| Change (%) | -25.56% | -17.04% | -6.73% | - | +4.71% | +18.83% | +54.71% |
| Change | -0.114 | -0.076 | -0.030 | - | +0.021 | +0.084 | +0.244 |
| Level | Minor | Intermediate | Intermediate | - | Intermediate | Minor | Minor |
To determine price objectives, it is also possible to use the pivot points. Here is the price position in relation to pivot points:
| Pivot points | S3 | S2 | S1 | PP | R1 | R2 | R3 |
|---|---|---|---|---|---|---|---|
| Standard | 0.359 | 0.368 | 0.386 | 0.395 | 0.413 | 0.422 | 0.440 |
| Camarilla | 0.397 | 0.399 | 0.402 | 0.404 | 0.407 | 0.409 | 0.411 |
| Woodie | 0.364 | 0.370 | 0.391 | 0.397 | 0.418 | 0.424 | 0.445 |
| Fibonacci | 0.368 | 0.378 | 0.385 | 0.395 | 0.405 | 0.412 | 0.422 |
| Pivot points | S3 | S2 | S1 | PP | R1 | R2 | R3 |
|---|---|---|---|---|---|---|---|
| Standard | 0.365 | 0.367 | 0.368 | 0.370 | 0.371 | 0.373 | 0.374 |
| Camarilla | 0.369 | 0.370 | 0.370 | 0.370 | 0.370 | 0.371 | 0.371 |
| Woodie | 0.366 | 0.367 | 0.369 | 0.370 | 0.372 | 0.373 | 0.375 |
| Fibonacci | 0.367 | 0.368 | 0.369 | 0.370 | 0.371 | 0.372 | 0.373 |
| Pivot points | S3 | S2 | S1 | PP | R1 | R2 | R3 |
|---|---|---|---|---|---|---|---|
| Standard | 0.175 | 0.253 | 0.311 | 0.389 | 0.447 | 0.525 | 0.583 |
| Camarilla | 0.333 | 0.345 | 0.358 | 0.370 | 0.383 | 0.395 | 0.407 |
| Woodie | 0.166 | 0.248 | 0.302 | 0.384 | 0.438 | 0.520 | 0.574 |
| Fibonacci | 0.253 | 0.305 | 0.337 | 0.389 | 0.441 | 0.473 | 0.525 |
Numerical data
The following is the status of technical indicators and moving averages registered at the time this technical analysis was created:
| RSI (14): | 63.97 | |
| MACD (12,26,9): | -0.0020 | |
| Directional Movement: | 32.145 | |
| AROON (14): | 71.429 | |
| DEMA (21): | 0.385 | |
| Parabolic SAR (0,02-0,02-0,2): | 0.370 | |
| Elder Ray (13): | 0.036 | |
| Super Trend (3,10): | 0.376 | |
| Zig ZAG (10): | 0.446 | |
| VORTEX (21): | 1.0640 | |
| Stochastique (14,3,5): | 51.91 | |
| TEMA (21): | 0.392 | |
| Williams %R (14): | -4.88 | |
| Chande Momentum Oscillator (20): | 0.071 | |
| Repulse (5,40,3): | 18.2320 | |
| ROCnROLL: | 1 | |
| TRIX (15,9): | -0.3860 | |
| Courbe Coppock: | 0.85 |
| MA7: | 0.389 | |
| MA20: | 0.385 | |
| MA50: | 0.413 | |
| MA100: | 0.426 | |
| MAexp7: | 0.398 | |
| MAexp20: | 0.392 | |
| MAexp50: | 0.406 | |
| MAexp100: | 0.424 | |
| Price / MA7: | +14.65% | |
| Price / MA20: | +15.84% | |
| Price / MA50: | +7.99% | |
| Price / MA100: | +4.69% | |
| Price / MAexp7: | +12.06% | |
| Price / MAexp20: | +13.78% | |
| Price / MAexp50: | +9.85% | |
| Price / MAexp100: | +5.19% |
News
Don't forget to follow the news on ALTHEORA. At the time of publication of this analysis, the latest news was as follows:
- ALTHEORA: Strong acceleration of activity in 2021: +15% - 2022 Orders: +16%
- ALTHEORA: 2022 financial calendar
-
 Mecelec
-
Mecelec
About author
Online


Add a comment
Comments
0 comments on the analysis ALTHEORA - Daily