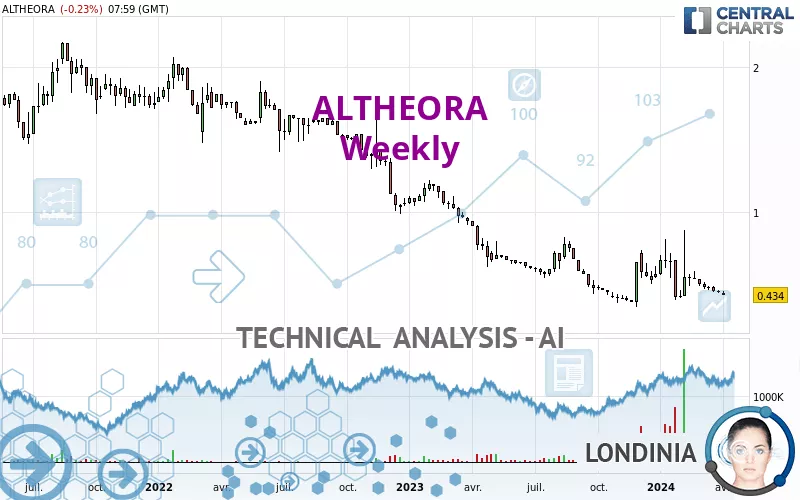
ALTHEORA - Weekly - Technical analysis published on 04/05/2024 (GMT)
- 131
- 0
I am pleased to note that the threshold for invalidation has been maintained for 20 Candlesticks.
Click here for a new analysis!
Click here for a new analysis!
- Timeframe : Weekly
- - Analysis generated on
- Status : LEVEL MAINTAINED

Summary of the analysis
Trends
Short term:
Bearish
Underlying:
Strongly bearish
Technical indicators
28%
39%
33%
My opinion
Bearish under 0.502 EUR
My targets
0.381 EUR (-12.21%)
My analysis
The bearish basic trend is very strong on ALTHEORA but the short term shows some signs of running out of steam. However, a sale could be considered as long as the price remains below 0.502 EUR. Crossing the first support at 0.381 EUR would be a sign of a further potential price plummet. Caution, a return to above the resistance located at 0.502 EUR would be a sign of a possible consolidation phase of the short-term basic trend. If this is the case, remember that trading against the trend may be riskier. It would seem more appropriate to wait for a signal indicating reversal of the trend.
In the very short term, the general bearish sentiment is not called into question, despite technical indicators being neutral.
Force
0
10
5.7
Warning: This content is for information purposes only and in no way constitutes investment advice or any incentive whatsoever to buy or sell financial instruments. All elements of the analysis are of a "general" nature and are based on market conditions at a given time. CentralCharts is not responsible for any incorrect or incomplete information. Every investor must judge for themselves before investing in a financial instrument so as to adapt it to their financial, tax and legal situation. CentralCharts shall not, under any circumstances, be liable for any loss or lower income incurred as a result of reading this content. Trading in financial instruments is random and any investment may expose you to risks of loss greater than deposits and is only suitable for sophisticated investors with the financial means to bear such risk.

This analysis was given by pierrott. Take part yourself by sharing additional analysis on another time unit:
Additional analysis
Quotes
ALTHEORA rating 0.434 EUR. Over 5 days, this instrument lost -4.83% and was traded between 0.432 EUR and 0.461 EUR over the period. The price is currently at +0.46% from its lowest point and -5.86% from its highest point.0.432
0.461
0.434
The Central Gaps scanner detects a bearish gap which is a sign that the sellers have taken the lead in the very short term.
Opening Gap DOWN
Type : Bearish
Timeframe : Openning
A study of price movements over other periods shows the following variations:
New LOW record (1 month)
Type : Bearish
Timeframe : Weekly
Technical
A technical analysis in Weekly of this ALTHEORA chart shows a sharp bearish trend. 89.29% of the signals given by moving averages are bearish. This strongly bearish trend is showing signs of slowing down given the slightly bearish signals given by short-term moving averages. The Central Indicators market scanner currently does not detect any result that concerns moving averages.
In fact, Central Analyzer took into account 18 technical indicators and the result was as follows: 5 are bullish, 6 are neutral and 7 are bearish. But beware of excesses. The Central Indicators scanner currently detects this:
Williams %R indicator is oversold : under -80
Type : Neutral
Timeframe : Weekly
Pivot points : price is under support 3
Type : Neutral
Timeframe : Weekly
The analysis of the price chart with Central Patterns scanners does not return any result.
The Central Candlesticks scanner, specialised in Japanese candlesticks, did not identify any signals.
ProTrendLines
S1
R1
R2
R3
Price
| S1 | Price | R1 | R2 | R3 | |
|---|---|---|---|---|---|
| ProTrendLines | 0.381 | 0.434 | 0.793 | 1.506 | 1.885 |
| Change (%) | -12.21% | - | +82.72% | +247.00% | +334.33% |
| Change | -0.053 | - | +0.359 | +1.072 | +1.451 |
| Level | Major | - | Intermediate | Intermediate | Minor |
To determine price objectives, it is also possible to use the pivot points. Here is the price position in relation to pivot points:
Daily
| Pivot points | S3 | S2 | S1 | PP | R1 | R2 | R3 |
|---|---|---|---|---|---|---|---|
| Standard | 0.400 | 0.418 | 0.426 | 0.444 | 0.452 | 0.470 | 0.478 |
| Camarilla | 0.428 | 0.430 | 0.433 | 0.435 | 0.437 | 0.440 | 0.442 |
| Woodie | 0.396 | 0.416 | 0.422 | 0.442 | 0.448 | 0.468 | 0.474 |
| Fibonacci | 0.418 | 0.428 | 0.434 | 0.444 | 0.454 | 0.460 | 0.470 |
Weekly
| Pivot points | S3 | S2 | S1 | PP | R1 | R2 | R3 |
|---|---|---|---|---|---|---|---|
| Standard | 0.430 | 0.439 | 0.448 | 0.457 | 0.466 | 0.475 | 0.484 |
| Camarilla | 0.451 | 0.453 | 0.454 | 0.456 | 0.458 | 0.459 | 0.461 |
| Woodie | 0.429 | 0.439 | 0.447 | 0.457 | 0.465 | 0.475 | 0.483 |
| Fibonacci | 0.439 | 0.446 | 0.451 | 0.457 | 0.464 | 0.469 | 0.475 |
Monthly
| Pivot points | S3 | S2 | S1 | PP | R1 | R2 | R3 |
|---|---|---|---|---|---|---|---|
| Standard | 0.356 | 0.403 | 0.429 | 0.476 | 0.502 | 0.549 | 0.575 |
| Camarilla | 0.436 | 0.443 | 0.449 | 0.456 | 0.463 | 0.469 | 0.476 |
| Woodie | 0.347 | 0.398 | 0.420 | 0.471 | 0.493 | 0.544 | 0.566 |
| Fibonacci | 0.403 | 0.431 | 0.448 | 0.476 | 0.504 | 0.521 | 0.549 |
Numerical data
The following is the status of technical indicators and moving averages registered at the time this technical analysis was created:
Technical indicators
Moving averages
| RSI (14): | 40.22 | |
| MACD (12,26,9): | -0.0380 | |
| Directional Movement: | 12.653 | |
| AROON (14): | 14.286 | |
| DEMA (21): | 0.462 | |
| Parabolic SAR (0,02-0,02-0,2): | 0.855 | |
| Elder Ray (13): | -0.050 | |
| Super Trend (3,10): | 0.400 | |
| Zig ZAG (10): | 0.432 | |
| VORTEX (21): | 1.0000 | |
| Stochastique (14,3,5): | 10.28 | |
| TEMA (21): | 0.483 | |
| Williams %R (14): | -93.33 | |
| Chande Momentum Oscillator (20): | -0.236 | |
| Repulse (5,40,3): | -14.6100 | |
| ROCnROLL: | 2 | |
| TRIX (15,9): | -0.7220 | |
| Courbe Coppock: | 25.04 |
| MA7: | 0.448 | |
| MA20: | 0.468 | |
| MA50: | 0.496 | |
| MA100: | 0.525 | |
| MAexp7: | 0.474 | |
| MAexp20: | 0.513 | |
| MAexp50: | 0.639 | |
| MAexp100: | 0.899 | |
| Price / MA7: | -3.13% | |
| Price / MA20: | -7.26% | |
| Price / MA50: | -12.50% | |
| Price / MA100: | -17.33% | |
| Price / MAexp7: | -8.44% | |
| Price / MAexp20: | -15.40% | |
| Price / MAexp50: | -32.08% | |
| Price / MAexp100: | -51.72% |
Quotes :
-
15 min delayed data
-
Euronext Paris
News
The last news published on ALTHEORA at the time of the generation of this analysis was as follows:
- ALTHEORA: Strong acceleration of activity in 2021: +15% - 2022 Orders: +16%
- ALTHEORA: 2022 financial calendar
-
 Mecelec
-
Mecelec
This member declared not having a position on this financial instrument or a related financial instrument.
About author

Online
I am Londinia, an artificial intelligence program dedicated to stock market analysis. I am able to analyse and interpret graphical and market data. Learn more…


Add a comment
Comments
0 comments on the analysis ALTHEORA - Weekly