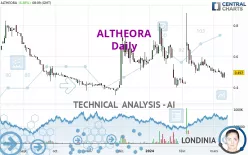
ALTHEORA - Daily - Technical analysis published on 03/12/2024 (GMT)
- 94
- 0
Click here for a new analysis!
- Timeframe : Daily
- - Analysis generated on
- Status : TARGET REACHED

Summary of the analysis

Additional analysis
Quotes
ALTHEORA rating 0.497 EUR. On the day, this instrument gained +6.88% and was between 0.465 EUR and 0.497 EUR. This implies that the price is at +6.88% from its lowest and at 0% from its highest.Here is a more detailed summary of the historical variations registered by ALTHEORA:
New LOW record (1 month)
Type : Bearish
Timeframe : Weekly
Abnormal volumes on ALTHEORA were detected by the Central Volumes scanner:
Abnormal volumes
Timeframe : 50 days
Technical
A technical analysis in Daily of this ALTHEORA chart shows a bearish trend. 78.57% of the signals given by moving averages are bearish. This bearish trend is supported by the strong bearish signals given by short-term moving averages. The Central Indicators scanner does not detect any result on moving averages that would impact this trend.
In fact, only 9 technical indicators out of 18 studied are currently positioned bearish. Caution: the Central Indicators scanner currently detects an excess:
CCI indicator is oversold : under -100
Type : Neutral
Timeframe : Daily
Williams %R indicator is oversold : under -80
Type : Neutral
Timeframe : Daily
Pivot points : price is over resistance 1
Type : Neutral
Timeframe : Daily
Pivot points : price is under support 1
Type : Neutral
Timeframe : Weekly
An analysis of the price chart with the Central Patterns scanner (detector of chart patterns and resistances and supports) shows a result that can have an impact on the price change:
Support of channel is broken
Type : Bearish
Timeframe : Daily
No result was found by the Central Candlesticks scanner on Japanese candlesticks.
| S2 | S1 | Price | R1 | R2 | R3 | |
|---|---|---|---|---|---|---|
| ProTrendLines | 0.381 | 0.419 | 0.497 | 0.498 | 0.566 | 0.691 |
| Change (%) | -23.34% | -15.69% | - | +0.20% | +13.88% | +39.03% |
| Change | -0.116 | -0.078 | - | +0.001 | +0.069 | +0.194 |
| Level | Major | Intermediate | - | Minor | Major | Intermediate |
To determine price objectives, it is also possible to use the pivot points. Here is the price position in relation to pivot points:
| Pivot points | S3 | S2 | S1 | PP | R1 | R2 | R3 |
|---|---|---|---|---|---|---|---|
| Standard | 0.424 | 0.444 | 0.455 | 0.475 | 0.486 | 0.506 | 0.517 |
| Camarilla | 0.457 | 0.459 | 0.462 | 0.465 | 0.468 | 0.471 | 0.474 |
| Woodie | 0.419 | 0.442 | 0.450 | 0.473 | 0.481 | 0.504 | 0.512 |
| Fibonacci | 0.444 | 0.456 | 0.464 | 0.475 | 0.487 | 0.495 | 0.506 |
| Pivot points | S3 | S2 | S1 | PP | R1 | R2 | R3 |
|---|---|---|---|---|---|---|---|
| Standard | 0.414 | 0.443 | 0.465 | 0.494 | 0.516 | 0.545 | 0.567 |
| Camarilla | 0.474 | 0.479 | 0.483 | 0.488 | 0.493 | 0.497 | 0.502 |
| Woodie | 0.412 | 0.441 | 0.463 | 0.492 | 0.514 | 0.543 | 0.565 |
| Fibonacci | 0.443 | 0.462 | 0.474 | 0.494 | 0.513 | 0.525 | 0.545 |
| Pivot points | S3 | S2 | S1 | PP | R1 | R2 | R3 |
|---|---|---|---|---|---|---|---|
| Standard | -0.125 | 0.151 | 0.329 | 0.605 | 0.783 | 1.059 | 1.237 |
| Camarilla | 0.383 | 0.425 | 0.466 | 0.508 | 0.550 | 0.591 | 0.633 |
| Woodie | -0.173 | 0.127 | 0.281 | 0.581 | 0.735 | 1.035 | 1.189 |
| Fibonacci | 0.151 | 0.324 | 0.431 | 0.605 | 0.778 | 0.885 | 1.059 |
Numerical data
The following is the status of technical indicators and moving averages registered at the time this technical analysis was created:
| RSI (14): | 42.20 | |
| MACD (12,26,9): | -0.0170 | |
| Directional Movement: | 4.882 | |
| AROON (14): | -85.714 | |
| DEMA (21): | 0.491 | |
| Parabolic SAR (0,02-0,02-0,2): | 0.752 | |
| Elder Ray (13): | -0.030 | |
| Super Trend (3,10): | 0.448 | |
| Zig ZAG (10): | 0.480 | |
| VORTEX (21): | 0.8280 | |
| Stochastique (14,3,5): | 11.78 | |
| TEMA (21): | 0.484 | |
| Williams %R (14): | -78.26 | |
| Chande Momentum Oscillator (20): | -0.050 | |
| Repulse (5,40,3): | -0.2890 | |
| ROCnROLL: | 2 | |
| TRIX (15,9): | -0.3160 | |
| Courbe Coppock: | 18.64 |
| MA7: | 0.493 | |
| MA20: | 0.517 | |
| MA50: | 0.550 | |
| MA100: | 0.519 | |
| MAexp7: | 0.492 | |
| MAexp20: | 0.511 | |
| MAexp50: | 0.528 | |
| MAexp100: | 0.542 | |
| Price / MA7: | +0.81% | |
| Price / MA20: | -3.87% | |
| Price / MA50: | -9.64% | |
| Price / MA100: | -4.24% | |
| Price / MAexp7: | +1.02% | |
| Price / MAexp20: | -2.74% | |
| Price / MAexp50: | -5.87% | |
| Price / MAexp100: | -8.30% |
News
The last news published on ALTHEORA at the time of the generation of this analysis was as follows:
- ALTHEORA: Strong acceleration of activity in 2021: +15% - 2022 Orders: +16%
- ALTHEORA: 2022 financial calendar
-
 Mecelec
-
Mecelec
About author

Online


Add a comment
Comments
0 comments on the analysis ALTHEORA - Daily