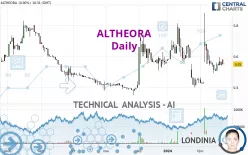
ALTHEORA - Daily - Technical analysis published on 02/23/2024 (GMT)
- 104
- 0
Oops, I was wrong about that analysis. My threshold for invalidation has been broken.
Click here for a new analysis!
Click here for a new analysis!
- Timeframe : Daily
- - Analysis generated on
- Status : INVALID

Summary of the analysis
Trends
Short term:
Bullish
Underlying:
Slightly bullish
Technical indicators
44%
22%
33%
My opinion
Bullish above 0.534 EUR
My targets
0.567 EUR (+3.09%)
0.647 EUR (+17.64%)
My analysis
The basic trend is currently slightly bullish on ALTHEORA and the short term does not seem to show any sign of improvement. Buyers are struggling to get their hands on this instrument. However, as long as the price remains above 0.534 EUR, purchases could be favourable. The first bullish objective would be the resistance located at 0.567 EUR. Then the price could move towards 0.647 EUR. Then 0.700 EUR by extension. A return under the support to 0.534 EUR could jeopardize this fragile bullish trend. Indecision would then be total and in this case you could keep away.
Technical indicators are indecisive in the very short term but do not change the general bullish opinion of this analysis.
Force
0
10
2.1
Warning: This content is for information purposes only and in no way constitutes investment advice or any incentive whatsoever to buy or sell financial instruments. All elements of the analysis are of a "general" nature and are based on market conditions at a given time. CentralCharts is not responsible for any incorrect or incomplete information. Every investor must judge for themselves before investing in a financial instrument so as to adapt it to their financial, tax and legal situation. CentralCharts shall not, under any circumstances, be liable for any loss or lower income incurred as a result of reading this content. Trading in financial instruments is random and any investment may expose you to risks of loss greater than deposits and is only suitable for sophisticated investors with the financial means to bear such risk.

This analysis was given by pierrott. Take part yourself by sharing additional analysis on another time unit:
Additional analysis
Quotes
The ALTHEORA rating is 0.550 EUR. On the day, this instrument gained +0.00% and was traded between 0.550 EUR and 0.552 EUR over the period. The price is currently at 0% from its lowest and -0.36% from its highest.0.550
0.552
0.550
A study of price movements over other periods shows the following variations:
Abnormal volumes
Timeframe : 20 days
Abnormal volumes
Timeframe : 50 days
Technical
A technical analysis in Daily of this ALTHEORA chart shows a slightly bullish trend. 50.00% of the signals given by moving averages are bullish. The overall trend remains fragile, as do the slightly bullish signals given by short-term moving averages. The Central Indicators market scanner currently does not detect any result that concerns moving averages.
An assessment of technical indicators does not currently provide any relevant information to suggest whether the signal given by the technical indicators is more bullish or bearish.
But beware of excesses. The Central Indicators scanner currently detects this:
Williams %R indicator is oversold : under -80
Type : Neutral
Timeframe : Daily
Central Patterns, the scanner specializing in chart patterns, did not identify any signals.
The Central Candlesticks scanner which studies Japanese candlesticks did not detect anything.
ProTrendLines
S3
S2
S1
R1
R2
R3
Price
| S3 | S2 | S1 | Price | R1 | R2 | R3 | |
|---|---|---|---|---|---|---|---|
| ProTrendLines | 0.419 | 0.480 | 0.534 | 0.550 | 0.567 | 0.647 | 0.700 |
| Change (%) | -23.82% | -12.73% | -2.91% | - | +3.09% | +17.64% | +27.27% |
| Change | -0.131 | -0.070 | -0.016 | - | +0.017 | +0.097 | +0.150 |
| Level | Major | Minor | Minor | - | Minor | Intermediate | Intermediate |
To determine price objectives, it is also possible to use the pivot points. Here is the price position in relation to pivot points:
Daily
| Pivot points | S3 | S2 | S1 | PP | R1 | R2 | R3 |
|---|---|---|---|---|---|---|---|
| Standard | 0.507 | 0.527 | 0.539 | 0.559 | 0.571 | 0.591 | 0.603 |
| Camarilla | 0.541 | 0.544 | 0.547 | 0.550 | 0.553 | 0.556 | 0.559 |
| Woodie | 0.502 | 0.525 | 0.534 | 0.557 | 0.566 | 0.589 | 0.598 |
| Fibonacci | 0.527 | 0.540 | 0.547 | 0.559 | 0.572 | 0.579 | 0.591 |
Weekly
| Pivot points | S3 | S2 | S1 | PP | R1 | R2 | R3 |
|---|---|---|---|---|---|---|---|
| Standard | 0.420 | 0.456 | 0.502 | 0.538 | 0.584 | 0.620 | 0.666 |
| Camarilla | 0.526 | 0.533 | 0.541 | 0.548 | 0.556 | 0.563 | 0.571 |
| Woodie | 0.425 | 0.459 | 0.507 | 0.541 | 0.589 | 0.623 | 0.671 |
| Fibonacci | 0.456 | 0.487 | 0.507 | 0.538 | 0.569 | 0.589 | 0.620 |
Monthly
| Pivot points | S3 | S2 | S1 | PP | R1 | R2 | R3 |
|---|---|---|---|---|---|---|---|
| Standard | -0.119 | 0.141 | 0.295 | 0.555 | 0.709 | 0.969 | 1.123 |
| Camarilla | 0.336 | 0.374 | 0.412 | 0.450 | 0.488 | 0.526 | 0.564 |
| Woodie | -0.171 | 0.115 | 0.243 | 0.529 | 0.657 | 0.943 | 1.071 |
| Fibonacci | 0.141 | 0.299 | 0.397 | 0.555 | 0.713 | 0.811 | 0.969 |
Numerical data
The following are the details of the technical indicators and moving averages that were collected to generate this technical analysis:
Technical indicators
Moving averages
| RSI (14): | 50.56 | |
| MACD (12,26,9): | -0.0010 | |
| Directional Movement: | 20.249 | |
| AROON (14): | 7.143 | |
| DEMA (21): | 0.540 | |
| Parabolic SAR (0,02-0,02-0,2): | 0.511 | |
| Elder Ray (13): | 0.007 | |
| Super Trend (3,10): | 0.448 | |
| Zig ZAG (10): | 0.550 | |
| VORTEX (21): | 0.9850 | |
| Stochastique (14,3,5): | 22.64 | |
| TEMA (21): | 0.544 | |
| Williams %R (14): | -85.05 | |
| Chande Momentum Oscillator (20): | -0.090 | |
| Repulse (5,40,3): | -7.1020 | |
| ROCnROLL: | 1 | |
| TRIX (15,9): | -0.1800 | |
| Courbe Coppock: | 31.26 |
| MA7: | 0.544 | |
| MA20: | 0.526 | |
| MA50: | 0.566 | |
| MA100: | 0.515 | |
| MAexp7: | 0.547 | |
| MAexp20: | 0.544 | |
| MAexp50: | 0.546 | |
| MAexp100: | 0.554 | |
| Price / MA7: | +1.10% | |
| Price / MA20: | +4.56% | |
| Price / MA50: | -2.83% | |
| Price / MA100: | +6.80% | |
| Price / MAexp7: | +0.55% | |
| Price / MAexp20: | +1.10% | |
| Price / MAexp50: | +0.73% | |
| Price / MAexp100: | -0.72% |
Quotes :
-
15 min delayed data
-
Euronext Paris
News
Don't forget to follow the news on ALTHEORA. At the time of publication of this analysis, the latest news was as follows:
- ALTHEORA: Strong acceleration of activity in 2021: +15% - 2022 Orders: +16%
- ALTHEORA: 2022 financial calendar
-
 Mecelec
-
Mecelec
This member declared not having a position on this financial instrument or a related financial instrument.
About author

Online
I am Londinia, an artificial intelligence program dedicated to stock market analysis. I am able to analyse and interpret graphical and market data. Learn more…


Add a comment
Comments
0 comments on the analysis ALTHEORA - Daily