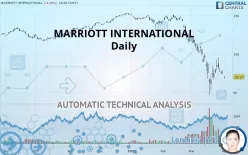
MARRIOTT INTERNATIONAL - Daily - Technical analysis published on 04/01/2020 (GMT)
- 496
- 0
- Who voted?
Click here for a new analysis!
- Timeframe : Daily
- - Analysis generated on
- Status : TARGET REACHED

Summary of the analysis

Additional analysis
Quotes
The MARRIOTT INTERNATIONAL price is 70.13 USD. The price is lower by -6.26% since the last closing with the lowest point at 68.02 USD and the highest point at 71.41 USD. The deviation from the price is +3.10% for the low point and -1.79% for the high point.A bearish gap was detected at the opening by the Central Gaps scanner. There are a lot of sellers and they have the upper hand in the very short term.
Opening Gap DOWN
Type : Bearish
Timeframe : Openning
So that you have an overall view of the price change, here is a table showing the variations over several periods:
Abnormal volumes
Timeframe : 5 days
Abnormal volumes
Timeframe : 20 days
Abnormal volumes
Timeframe : 50 days
Technical
A technical analysis in Daily of this MARRIOTT INTERNATIONAL chart shows a sharp bearish trend. The signals given by moving averages are 92.86% bearish. This strong bearish trend is confirmed by the strong signals currently being given by short-term moving averages. There is no crossing of moving average by the price or crossing of moving averages between themselves.
In fact, only 9 technical indicators out of 18 studied are currently bearish. Caution: the Central Indicators scanner currently detects an excess:
Williams %R indicator is overbought : over -20
Type : Neutral
Timeframe : Daily
Pivot points : price is under support 3
Type : Neutral
Timeframe : Daily
Williams %R indicator is back over -50
Type : Bullish
Timeframe : Daily
No signals are given by Central Patterns, a market scanner specialised in chart patterns, resistances and supports.
Central Candlesticks, the scanner specialised in Japanese candlesticks, detects this inversion signal that could impact the current short-term trend:
Doji
Type : Neutral
Timeframe : Daily
| S3 | S2 | S1 | Price | R1 | R2 | R3 | |
|---|---|---|---|---|---|---|---|
| ProTrendLines | 12.51 | 51.87 | 63.81 | 70.13 | 73.27 | 84.83 | 100.99 |
| Change (%) | -82.16% | -26.04% | -9.01% | - | +4.48% | +20.96% | +44.00% |
| Change | -57.62 | -18.26 | -6.32 | - | +3.14 | +14.70 | +30.86 |
| Level | Minor | Major | Intermediate | - | Major | Intermediate | Major |
Pivot points can also be used to set your price objectives. Here is the price situation in relation to pivot points:
| Pivot points | S3 | S2 | S1 | PP | R1 | R2 | R3 |
|---|---|---|---|---|---|---|---|
| Standard | 68.42 | 71.47 | 73.14 | 76.19 | 77.86 | 80.91 | 82.58 |
| Camarilla | 73.51 | 73.95 | 74.38 | 74.81 | 75.24 | 75.68 | 76.11 |
| Woodie | 67.73 | 71.13 | 72.45 | 75.85 | 77.17 | 80.57 | 81.89 |
| Fibonacci | 71.47 | 73.27 | 74.39 | 76.19 | 77.99 | 79.11 | 80.91 |
| Pivot points | S3 | S2 | S1 | PP | R1 | R2 | R3 |
|---|---|---|---|---|---|---|---|
| Standard | 36.70 | 51.99 | 65.42 | 80.71 | 94.14 | 109.43 | 122.87 |
| Camarilla | 70.95 | 73.58 | 76.22 | 78.85 | 81.48 | 84.12 | 86.75 |
| Woodie | 35.77 | 51.52 | 64.49 | 80.25 | 93.21 | 108.97 | 121.93 |
| Fibonacci | 51.99 | 62.96 | 69.74 | 80.71 | 91.68 | 98.46 | 109.43 |
| Pivot points | S3 | S2 | S1 | PP | R1 | R2 | R3 |
|---|---|---|---|---|---|---|---|
| Standard | -37.51 | 4.53 | 39.67 | 81.70 | 116.85 | 158.88 | 194.02 |
| Camarilla | 53.59 | 60.66 | 67.74 | 74.81 | 81.89 | 88.96 | 96.03 |
| Woodie | -40.96 | 2.80 | 36.22 | 79.98 | 113.40 | 157.16 | 190.58 |
| Fibonacci | 4.53 | 34.01 | 52.22 | 81.70 | 111.19 | 129.40 | 158.88 |
Numerical data
The following are the details of the technical indicators and moving averages that were collected to generate this technical analysis:
| RSI (14): | 32.12 | |
| MACD (12,26,9): | -12.8500 | |
| Directional Movement: | -17.28 | |
| AROON (14): | -21.43 | |
| DEMA (21): | 69.39 | |
| Parabolic SAR (0,02-0,02-0,2): | 60.49 | |
| Elder Ray (13): | -10.80 | |
| Super Trend (3,10): | 93.54 | |
| Zig ZAG (10): | 70.73 | |
| VORTEX (21): | 0.7300 | |
| Stochastique (14,3,5): | 48.50 | |
| TEMA (21): | 67.02 | |
| Williams %R (14): | -55.90 | |
| Chande Momentum Oscillator (20): | -15.98 | |
| Repulse (5,40,3): | -3.9600 | |
| ROCnROLL: | 2 | |
| TRIX (15,9): | -1.8700 | |
| Courbe Coppock: | 45.63 |
| MA7: | 78.23 | |
| MA20: | 85.46 | |
| MA50: | 117.36 | |
| MA100: | 130.27 | |
| MAexp7: | 76.16 | |
| MAexp20: | 87.13 | |
| MAexp50: | 107.76 | |
| MAexp100: | 120.24 | |
| Price / MA7: | -10.35% | |
| Price / MA20: | -17.94% | |
| Price / MA50: | -40.24% | |
| Price / MA100: | -46.17% | |
| Price / MAexp7: | -7.92% | |
| Price / MAexp20: | -19.51% | |
| Price / MAexp50: | -34.92% | |
| Price / MAexp100: | -41.67% |
News
The last news published on MARRIOTT INTERNATIONAL at the time of the generation of this analysis was as follows:
- Marriott International Provides Business Update Amidst The Rapidly Evolving Coronavirus Situation
- SpringHill Suites by Marriott Partners With Society6 To Showcase Regionally Inspired Gallery Wall Art Collections In Over 450 Hotels
- Tribute Portfolio Continues To Grow Its Global Family Of Characterful Hotels With First Outpost In Frankfurt, Germany
- Marriott International Reports Fourth Quarter 2019 Results
- JW Marriott Orlando Bonnet Creek Resort & Spa Set To Debut In March 2020
About author

Online


Add a comment
Comments
0 comments on the analysis MARRIOTT INTERNATIONAL - Daily