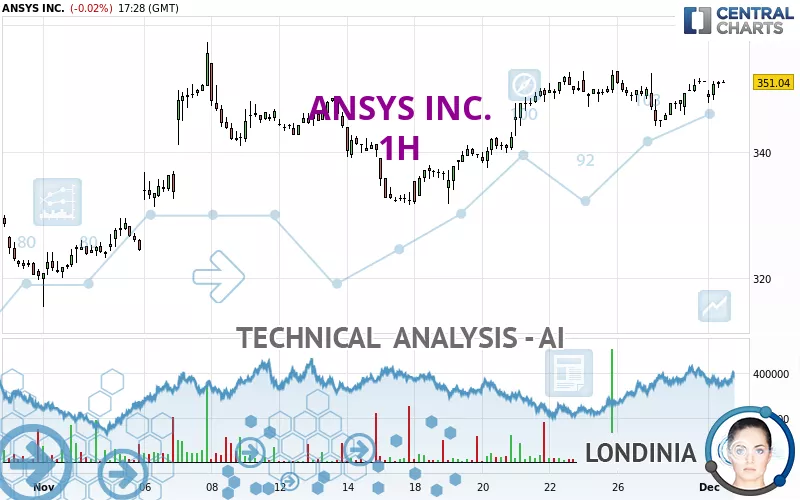
ANSYS INC. - 1H - Technical analysis published on 12/02/2024 (GMT)
- 94
- 0
Click here for a new analysis!
- Timeframe : 1H
- - Analysis generated on
- Status : TARGET REACHED

Summary of the analysis

Additional analysis
Quotes
ANSYS INC. rating 351.04 USD. On the day, this instrument lost -0.02% and was between 347.73 USD and 351.37 USD. This implies that the price is at +0.95% from its lowest and at -0.09% from its highest.The Central Gaps scanner detects a bearish opening. A small advantage for sellers in the very short term.
Bearish opening
Type : Bearish
Timeframe : Openning
Here is a more detailed summary of the historical variations registered by ANSYS INC.:
Near a new HIGH record (1 year)
Type : Bullish
Timeframe : Weekly
Near a new HIGH record (1st january)
Type : Bullish
Timeframe : Weekly
Near a new HIGH record (1 month)
Type : Bullish
Timeframe : Weekly
Technical
Technical analysis of ANSYS INC. in 1H shows a strongly overall bullish trend. 92.86% of the signals given by moving averages are bullish. This strongly bullish trend is supported by the strong bullish signals given by short-term moving averages. The Central Indicators scanner detects a bullish signal on moving averages that could impact this trend:
Bullish trend reversal : Moving Average 20
Type : Bullish
Timeframe : 1 hour
An assessment of technical indicators shows a strong bullish signal.
Caution: the Central Indicators scanner currently detects an excess:
CCI indicator is overbought : over 100
Type : Neutral
Timeframe : 1 hour
Williams %R indicator is overbought : over -20
Type : Neutral
Timeframe : 1 hour
Price is back over the pivot point
Type : Bullish
Timeframe : Weekly
No signals are given by Central Patterns, a market scanner specialised in chart patterns, resistances and supports.
No result was found by the Central Candlesticks scanner on Japanese candlesticks.
| S3 | S2 | S1 | Price | R1 | R2 | R3 | |
|---|---|---|---|---|---|---|---|
| ProTrendLines | 331.62 | 340.86 | 349.84 | 351.04 | 355.58 | 362.88 | 411.22 |
| Change (%) | -5.53% | -2.90% | -0.34% | - | +1.29% | +3.37% | +17.14% |
| Change | -19.42 | -10.18 | -1.20 | - | +4.54 | +11.84 | +60.18 |
| Level | Major | Intermediate | Intermediate | - | Major | Intermediate | Major |
Pivot points can also be used to set your price objectives. Here is the price situation in relation to pivot points:
| Pivot points | S3 | S2 | S1 | PP | R1 | R2 | R3 |
|---|---|---|---|---|---|---|---|
| Standard | 341.72 | 343.77 | 347.44 | 349.49 | 353.16 | 355.21 | 358.88 |
| Camarilla | 349.53 | 350.05 | 350.58 | 351.10 | 351.62 | 352.15 | 352.67 |
| Woodie | 342.52 | 344.18 | 348.24 | 349.90 | 353.96 | 355.62 | 359.68 |
| Fibonacci | 343.77 | 345.96 | 347.31 | 349.49 | 351.68 | 353.03 | 355.21 |
| Pivot points | S3 | S2 | S1 | PP | R1 | R2 | R3 |
|---|---|---|---|---|---|---|---|
| Standard | 336.56 | 340.21 | 345.65 | 349.30 | 354.74 | 358.39 | 363.83 |
| Camarilla | 348.60 | 349.43 | 350.27 | 351.10 | 351.93 | 352.77 | 353.60 |
| Woodie | 337.47 | 340.66 | 346.56 | 349.75 | 355.65 | 358.84 | 364.74 |
| Fibonacci | 340.21 | 343.68 | 345.82 | 349.30 | 352.77 | 354.91 | 358.39 |
| Pivot points | S3 | S2 | S1 | PP | R1 | R2 | R3 |
|---|---|---|---|---|---|---|---|
| Standard | 283.46 | 299.47 | 325.28 | 341.29 | 367.10 | 383.11 | 408.92 |
| Camarilla | 339.60 | 343.43 | 347.27 | 351.10 | 354.93 | 358.77 | 362.60 |
| Woodie | 288.37 | 301.92 | 330.19 | 343.74 | 372.01 | 385.56 | 413.83 |
| Fibonacci | 299.47 | 315.44 | 325.31 | 341.29 | 357.26 | 367.13 | 383.11 |
Numerical data
The following is the status of the technical indicators and moving averages at the time of publication of this technical analysis:
| RSI (14): | 57.26 | |
| MACD (12,26,9): | 0.7900 | |
| Directional Movement: | 6.66 | |
| AROON (14): | 57.15 | |
| DEMA (21): | 350.38 | |
| Parabolic SAR (0,02-0,02-0,2): | 346.22 | |
| Elder Ray (13): | 1.22 | |
| Super Trend (3,10): | 351.43 | |
| Zig ZAG (10): | 350.94 | |
| VORTEX (21): | 1.0600 | |
| Stochastique (14,3,5): | 87.69 | |
| TEMA (21): | 350.30 | |
| Williams %R (14): | -4.74 | |
| Chande Momentum Oscillator (20): | 5.44 | |
| Repulse (5,40,3): | 0.3400 | |
| ROCnROLL: | 1 | |
| TRIX (15,9): | 0.0200 | |
| Courbe Coppock: | 1.58 |
| MA7: | 350.17 | |
| MA20: | 342.82 | |
| MA50: | 331.03 | |
| MA100: | 323.45 | |
| MAexp7: | 350.33 | |
| MAexp20: | 349.21 | |
| MAexp50: | 347.35 | |
| MAexp100: | 344.09 | |
| Price / MA7: | +0.25% | |
| Price / MA20: | +2.40% | |
| Price / MA50: | +6.04% | |
| Price / MA100: | +8.53% | |
| Price / MAexp7: | +0.20% | |
| Price / MAexp20: | +0.52% | |
| Price / MAexp50: | +1.06% | |
| Price / MAexp100: | +2.02% |
News
The latest news and videos published on ANSYS INC. at the time of the analysis were as follows:
- Ansys Government Initiatives Selected to Join Microelectronics Commons to Support National Security
- Ansys to Drive Major Advances in AI-Powered Semiconductor Design Using NVIDIA AI
- Ansys Accelerates CFD Simulation by 110x with NVIDIA GH200 Grace Hopper Superchips
- Vertiv Uses Ansys Digital Engineering Technology to Drive R&D Transformation
- WEG Uses Ansys Simulation to Design Revolutionary Industrial Motor
About author
Online


Add a comment
Comments
0 comments on the analysis ANSYS INC. - 1H