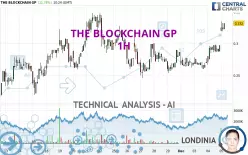
THE BLOCKCHAIN GP - 1H - Technical analysis published on 12/05/2024 (GMT)
- 92
- 0
Click here for a new analysis!
- Timeframe : 1H
- - Analysis generated on
- Status : INVALID

Summary of the analysis

Additional analysis
Quotes
The THE BLOCKCHAIN GP price is 0.3250 EUR. On the day, this instrument gained +9.43% with the lowest point at 0.3190 EUR and the highest point at 0.3350 EUR. The deviation from the price is +1.88% for the low point and -2.99% for the high point.A bullish gap was detected at the opening by the Central Gaps scanner. There are a lot of buyers and they have the upper hand in the very short term.
Opening Gap UP
Type : Bullish
Timeframe : Openning
So that you have an overall view of the price change, here is a table showing the variations over several periods:
Near a new HIGH record (1 year)
Type : Bullish
Timeframe : Weekly
Near a new HIGH record (1st january)
Type : Bullish
Timeframe : Weekly
Near a new HIGH record (1 month)
Type : Bullish
Timeframe : Weekly
The Central Volumes scanner notes the presence of abnormal volumes:
Abnormal volumes
Timeframe : 5 days
Abnormal volumes
Timeframe : 20 days
Abnormal volumes
Timeframe : 50 days
Technical
Technical analysis of THE BLOCKCHAIN GP in 1H shows a strongly overall bullish trend. 85.71% of the signals given by moving averages are bullish. This strongly bullish trend is supported by the strong bullish signals given by short-term moving averages. There is no crossing of moving average by the price or crossing of moving averages between themselves.
An assessment of technical indicators shows a strong bullish signal.
But beware of excesses. The Central Indicators scanner currently detects this:
RSI indicator is overbought : over 70
Type : Neutral
Timeframe : 1 hour
CCI indicator is overbought : over 100
Type : Neutral
Timeframe : 1 hour
Williams %R indicator is overbought : over -20
Type : Neutral
Timeframe : 1 hour
Pivot points : price is over resistance 1
Type : Neutral
Timeframe : Weekly
Pivot points : price is over resistance 2
Type : Neutral
Timeframe : 1 hour
An analysis of the price chart with the Central Patterns scanner (detector of chart patterns and resistances and supports) shows a result that can have an impact on the price change:
Near resistance of channel
Type : Bearish
Timeframe : 1 hour
The Central Candlesticks scanner which studies Japanese candlesticks did not detect anything.
| S3 | S2 | S1 | Price | R1 | R2 | R3 | |
|---|---|---|---|---|---|---|---|
| ProTrendLines | 0.2146 | 0.2700 | 0.2894 | 0.3250 | 0.3350 | 0.5763 | 0.9920 |
| Change (%) | -33.97% | -16.92% | -10.95% | - | +3.08% | +77.32% | +205.23% |
| Change | -0.1104 | -0.0550 | -0.0356 | - | +0.0100 | +0.2513 | +0.6670 |
| Level | Major | Intermediate | Major | - | Major | Minor | Intermediate |
Pivot points can also be used to set your price objectives. Here is the price situation in relation to pivot points:
| Pivot points | S3 | S2 | S1 | PP | R1 | R2 | R3 |
|---|---|---|---|---|---|---|---|
| Standard | 0.2448 | 0.2557 | 0.2763 | 0.2872 | 0.3078 | 0.3187 | 0.3393 |
| Camarilla | 0.2883 | 0.2912 | 0.2941 | 0.2970 | 0.2999 | 0.3028 | 0.3057 |
| Woodie | 0.2498 | 0.2581 | 0.2813 | 0.2896 | 0.3128 | 0.3211 | 0.3443 |
| Fibonacci | 0.2557 | 0.2677 | 0.2751 | 0.2872 | 0.2992 | 0.3066 | 0.3187 |
| Pivot points | S3 | S2 | S1 | PP | R1 | R2 | R3 |
|---|---|---|---|---|---|---|---|
| Standard | 0.1588 | 0.2022 | 0.2413 | 0.2847 | 0.3238 | 0.3672 | 0.4063 |
| Camarilla | 0.2578 | 0.2654 | 0.2729 | 0.2805 | 0.2881 | 0.2956 | 0.3032 |
| Woodie | 0.1568 | 0.2011 | 0.2393 | 0.2836 | 0.3218 | 0.3661 | 0.4043 |
| Fibonacci | 0.2022 | 0.2337 | 0.2532 | 0.2847 | 0.3162 | 0.3357 | 0.3672 |
| Pivot points | S3 | S2 | S1 | PP | R1 | R2 | R3 |
|---|---|---|---|---|---|---|---|
| Standard | -0.0447 | 0.0474 | 0.1639 | 0.2560 | 0.3725 | 0.4646 | 0.5811 |
| Camarilla | 0.2231 | 0.2423 | 0.2614 | 0.2805 | 0.2996 | 0.3187 | 0.3379 |
| Woodie | -0.0324 | 0.0535 | 0.1762 | 0.2621 | 0.3848 | 0.4707 | 0.5934 |
| Fibonacci | 0.0474 | 0.1271 | 0.1763 | 0.2560 | 0.3357 | 0.3849 | 0.4646 |
Numerical data
The following is the status of the technical indicators and moving averages at the time of publication of this technical analysis:
| RSI (14): | 73.02 | |
| MACD (12,26,9): | 0.0118 | |
| Directional Movement: | 28.1629 | |
| AROON (14): | 85.7143 | |
| DEMA (21): | 0.3062 | |
| Parabolic SAR (0,02-0,02-0,2): | 0.2893 | |
| Elder Ray (13): | 0.0263 | |
| Super Trend (3,10): | 0.2897 | |
| Zig ZAG (10): | 0.3255 | |
| VORTEX (21): | 1.0791 | |
| Stochastique (14,3,5): | 85.66 | |
| TEMA (21): | 0.3166 | |
| Williams %R (14): | -13.01 | |
| Chande Momentum Oscillator (20): | 0.0545 | |
| Repulse (5,40,3): | 0.8082 | |
| ROCnROLL: | 1 | |
| TRIX (15,9): | 0.3537 | |
| Courbe Coppock: | 30.63 |
| MA7: | 0.2873 | |
| MA20: | 0.2771 | |
| MA50: | 0.1877 | |
| MA100: | 0.1571 | |
| MAexp7: | 0.3100 | |
| MAexp20: | 0.2936 | |
| MAexp50: | 0.2839 | |
| MAexp100: | 0.2771 | |
| Price / MA7: | +13.12% | |
| Price / MA20: | +17.29% | |
| Price / MA50: | +73.15% | |
| Price / MA100: | +106.87% | |
| Price / MAexp7: | +4.84% | |
| Price / MAexp20: | +10.69% | |
| Price / MAexp50: | +14.48% | |
| Price / MAexp100: | +17.29% |
News
The latest news and videos published on THE BLOCKCHAIN GP at the time of the analysis were as follows:
About author
Online


Add a comment
Comments
0 comments on the analysis THE BLOCKCHAIN GP - 1H