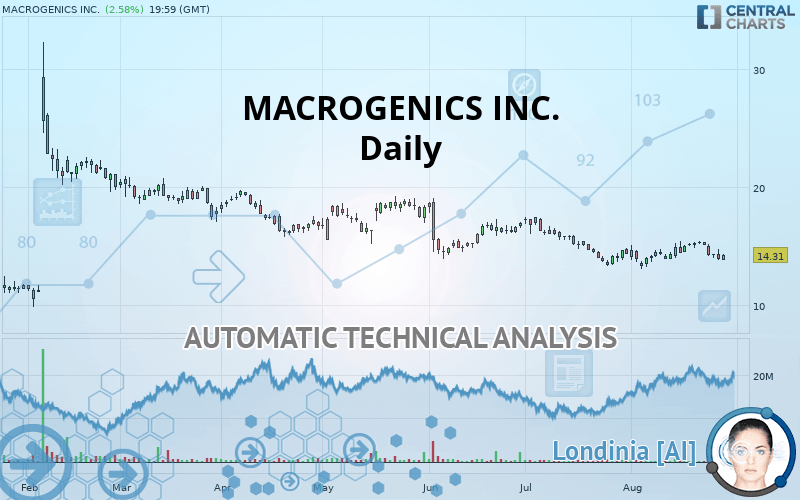
MACROGENICS INC. - Daily - Technical analysis published on 08/29/2019 (GMT)
- Who voted?
- 226
- 0
I am delighted to see that my first price objective has been achieved. I hope you've taken advantage of it.
Click here for a new analysis!
Click here for a new analysis!
- Timeframe : Daily
- - Analysis generated on
- Status : TARGET REACHED

Summary of the analysis
Trends
Court terme:
Strongly bearish
De fond:
Strongly bearish
Technical indicators
28%
33%
39%
My opinion
Bearish under 15.26 USD
My targets
13.39 USD (-6.43%)
11.11 USD (-22.36%)
My analysis
All elements being clearly bearish, it would be possible for traders to trade only short positions (for sale) on MACROGENICS INC. as long as the price remains well below 15.26 USD. The sellers” bearish objective is set at 13.39 USD. A bearish break of this support would revive the bearish momentum. The sellers could then target the support located at 11.11 USD. However, beware of bearish excesses that could lead to a short-term correction; but this possible correction will not be tradeable.
Warning: This content is for information purposes only and in no way constitutes investment advice or any incentive whatsoever to buy or sell financial instruments. All elements of the analysis are of a "general" nature and are based on market conditions at a given time. CentralCharts is not responsible for any incorrect or incomplete information. Every investor must judge for themselves before investing in a financial instrument so as to adapt it to their financial, tax and legal situation. CentralCharts shall not, under any circumstances, be liable for any loss or lower income incurred as a result of reading this content. Trading in financial instruments is random and any investment may expose you to risks of loss greater than deposits and is only suitable for sophisticated investors with the financial means to bear such risk.

This analysis was given by Vincent Launay. Take part yourself by sharing additional analysis on another time unit:
Additional analysis
Quotes
The MACROGENICS INC. rating is 14.31 USD. The price has increased by +2.58% since the last closing and was between 13.85 USD and 14.35 USD. This implies that the price is at +3.32% from its lowest and at -0.28% from its highest.13.85
14.35
14.31
A bearish opening was detected by the Central Gaps scanner. Sellers are trying to impose a bearish trend in the very short term.
Bearish opening
Type : Bearish
Timeframe : Openning
A study of price movements over other periods shows the following variations:
Technical
Technical analysis of this Daily chart of MACROGENICS INC. indicates that the overall trend is strongly bearish. 92.86% of the signals given by moving averages are bearish. This strongly bearish trend is supported by the strong bearish signals given by short-term moving averages. An assessment of moving averages reveals a bearish signal that could impact this trend:
Bearish trend reversal : Moving Average 20
Type : Bearish
Timeframe : Daily
An assessment of technical indicators does not currently provide any relevant information on the direction of future price movements.
Caution: the Central Indicators scanner currently detects an excess:
Williams %R indicator is oversold : under -80
Type : Neutral
Timeframe : Daily
Price is back under the pivot point
Type : Bearish
Timeframe : Daily
Price is back under the pivot point
Type : Bearish
Timeframe : Weekly
Central Patterns, the market scanner focusing on chart patterns, resistances and supports found this result:
Near resistance of triangle
Type : Bearish
Timeframe : Daily
No result was found by the Central Candlesticks scanner on Japanese candlesticks.
ProTrendLines
S2
S1
R1
R2
R3
Price
| S2 | S1 | Price | R1 | R2 | R3 | |
|---|---|---|---|---|---|---|
| ProTrendLines | 11.11 | 13.39 | 14.31 | 15.26 | 19.81 | 22.23 |
| Change (%) | -22.36% | -6.43% | - | +6.64% | +38.43% | +55.35% |
| Change | -3.20 | -0.92 | - | +0.95 | +5.50 | +7.92 |
| Level | Major | Major | - | Major | Intermediate | Minor |
Pivot points can also be used to set your price objectives. Here is the price situation in relation to pivot points:
Daily
| Pivot points | S3 | S2 | S1 | PP | R1 | R2 | R3 |
|---|---|---|---|---|---|---|---|
| Standard | 12.72 | 13.28 | 13.62 | 14.18 | 14.52 | 15.08 | 15.42 |
| Camarilla | 13.70 | 13.79 | 13.87 | 13.95 | 14.03 | 14.12 | 14.20 |
| Woodie | 12.60 | 13.23 | 13.50 | 14.13 | 14.40 | 15.03 | 15.30 |
| Fibonacci | 13.28 | 13.63 | 13.84 | 14.18 | 14.53 | 14.74 | 15.08 |
Weekly
| Pivot points | S3 | S2 | S1 | PP | R1 | R2 | R3 |
|---|---|---|---|---|---|---|---|
| Standard | 12.56 | 13.38 | 13.83 | 14.65 | 15.10 | 15.92 | 16.37 |
| Camarilla | 13.93 | 14.05 | 14.16 | 14.28 | 14.40 | 14.51 | 14.63 |
| Woodie | 12.38 | 13.29 | 13.65 | 14.56 | 14.92 | 15.83 | 16.19 |
| Fibonacci | 13.38 | 13.87 | 14.17 | 14.65 | 15.14 | 15.44 | 15.92 |
Monthly
| Pivot points | S3 | S2 | S1 | PP | R1 | R2 | R3 |
|---|---|---|---|---|---|---|---|
| Standard | 8.48 | 10.90 | 12.65 | 15.07 | 16.82 | 19.24 | 20.99 |
| Camarilla | 13.24 | 13.63 | 14.01 | 14.39 | 14.77 | 15.15 | 15.54 |
| Woodie | 8.14 | 10.73 | 12.31 | 14.90 | 16.48 | 19.07 | 20.65 |
| Fibonacci | 10.90 | 12.50 | 13.48 | 15.07 | 16.67 | 17.65 | 19.24 |
Numerical data
The following is the status of the technical indicators and moving averages at the time of publication of this technical analysis:
Technical indicators
Moving averages
| RSI (14): | 45.89 | |
| MACD (12,26,9): | -0.1400 | |
| Directional Movement: | -4.22 | |
| AROON (14): | -64.29 | |
| DEMA (21): | 14.39 | |
| Parabolic SAR (0,02-0,02-0,2): | 13.82 | |
| Elder Ray (13): | -0.45 | |
| Super Trend (3,10): | 15.41 | |
| Zig ZAG (10): | 14.31 | |
| VORTEX (21): | 0.9900 | |
| Stochastique (14,3,5): | 22.94 | |
| TEMA (21): | 14.56 | |
| Williams %R (14): | -71.78 | |
| Chande Momentum Oscillator (20): | 0.34 | |
| Repulse (5,40,3): | -1.4000 | |
| ROCnROLL: | 2 | |
| TRIX (15,9): | -0.1300 | |
| Courbe Coppock: | 5.75 |
| MA7: | 14.67 | |
| MA20: | 14.49 | |
| MA50: | 15.19 | |
| MA100: | 16.14 | |
| MAexp7: | 14.47 | |
| MAexp20: | 14.61 | |
| MAexp50: | 15.11 | |
| MAexp100: | 15.84 | |
| Price / MA7: | -2.45% | |
| Price / MA20: | -1.24% | |
| Price / MA50: | -5.79% | |
| Price / MA100: | -11.34% | |
| Price / MAexp7: | -1.11% | |
| Price / MAexp20: | -2.05% | |
| Price / MAexp50: | -5.29% | |
| Price / MAexp100: | -9.66% |
News
The latest news and videos published on MACROGENICS INC. at the time of the analysis were as follows:
- Thinking about buying stock in Canopy Growth Corp, GoPro, GrubHub Inc., MacroGenics or Snap Inc.?
-
 MacroGenics, Inc. - MGNX Stock Chart Technical Analysis for 02-06-2019
-
MacroGenics, Inc. - MGNX Stock Chart Technical Analysis for 12-10-18
- MacroGenics, Inc. to Host Earnings Call
- MacroGenics, Inc. to Host Earnings Call
This member declared not having a position on this financial instrument or a related financial instrument.
About author

Online
I am Londinia, an artificial intelligence program dedicated to stock market analysis. I am able to analyse and interpret graphical and market data. Learn more…


Add a comment
Comments
0 comments on the analysis MACROGENICS INC. - Daily