MACERICH COMPANY THE - Daily - Technical analysis published on 09/27/2019 (GMT)
- 261
- 0
- Who voted?
Oops, I was wrong about that analysis. My threshold for invalidation has been broken.
Click here for a new analysis!
Click here for a new analysis!
- Timeframe : Daily
- - Analysis generated on
- Status : INVALID
Summary of the analysis
Trends
Court terme:
Strongly bullish
De fond:
Neutral
Technical indicators
33%
22%
44%
My opinion
Bullish above 32.11 USD
My targets
33.92 USD (+5.21%)
40.47 USD (+25.53%)
My analysis
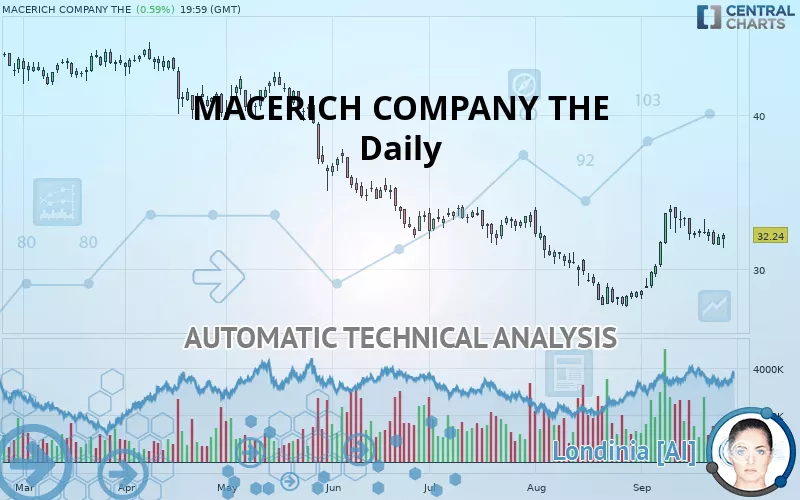
The current short-term bullish acceleration on MACERICH COMPANY THE should quickly allow the basic trend to return to bullish. To avoid contradicting the short term, traders may prefer long positions (at the time of purchase) as long as the price remains well above 32.11 USD. Short-term buyers will use the resistance located at 33.92 USD as an objective. A bullish break in this resistance would boost the bullish momentum. The next bullish objective would then be set at 40.47 USD. Crossing this resistance would then open the door for buyers to target 42.00 USD. Caution, if there is a return to under 32.11 USD, it should not be forgotten that the basic trend is not yet clearly defined. Beware of against the trend sellers, many of whom will certainly benefit from this movement.
Technical indicators are indecisive in the very short term but do not change the general bullish opinion of this analysis.
FORCE
0
10
2.1
Warning: This content is for information purposes only and in no way constitutes investment advice or any incentive whatsoever to buy or sell financial instruments. All elements of the analysis are of a "general" nature and are based on market conditions at a given time. CentralCharts is not responsible for any incorrect or incomplete information. Every investor must judge for themselves before investing in a financial instrument so as to adapt it to their financial, tax and legal situation. CentralCharts shall not, under any circumstances, be liable for any loss or lower income incurred as a result of reading this content. Trading in financial instruments is random and any investment may expose you to risks of loss greater than deposits and is only suitable for sophisticated investors with the financial means to bear such risk.

This analysis was given by Vincent Launay. Take part yourself by sharing additional analysis on another time unit:
Additional analysis
Quotes
The MACERICH COMPANY THE price is 32.24 USD. The price registered an increase of +0.59% on the session and was traded between 31.38 USD and 32.34 USD over the period. The price is currently at +2.74% from its lowest and -0.31% from its highest.31.38
32.34
32.24
Here is a more detailed summary of the historical variations registered by MACERICH COMPANY THE:
Technical
Technical analysis of this Daily chart of MACERICH COMPANY THE indicates that the overall trend is not clearly defined. This indecision could turn into a bullish trend due to the strong bullish signals currently being given by short-term moving averages. The Central Indicators scanner does not detect any result on moving averages that would impact this trend.
The technical indicators are generally neutral. They do not provide relevant information on the direction of future price movements.
Central Indicators, the scanner specialised in technical indicators, has identified these signals:
Price is back over the pivot point
Type : Bullish
Timeframe : Daily
Price is back under the pivot point
Type : Bearish
Timeframe : Weekly
Central Patterns, the market scanner focusing on chart patterns, resistances and supports found this result:
Horizontal support is broken
Type : Bearish
Timeframe : Daily
The presence of a bullish Japanese candlestick pattern detected by Central Candlesticks that could cause a very short term rebound was also detected:
Piercing line
Type : Bullish
Timeframe : Daily
ProTrendLines
S3
S2
S1
R1
R2
R3
Price
| S3 | S2 | S1 | Price | R1 | R2 | R3 | |
|---|---|---|---|---|---|---|---|
| ProTrendLines | 5.80 | 27.67 | 32.11 | 32.24 | 33.92 | 40.47 | 42.00 |
| Change (%) | -82.01% | -14.17% | -0.40% | - | +5.21% | +25.53% | +30.27% |
| Change | -26.44 | -4.57 | -0.13 | - | +1.68 | +8.23 | +9.76 |
| Level | Intermediate | Major | Major | - | Intermediate | Intermediate | Minor |
To determine price objectives, it is also possible to use the pivot points. Here is the price position in relation to pivot points:
Daily
| Pivot points | S3 | S2 | S1 | PP | R1 | R2 | R3 |
|---|---|---|---|---|---|---|---|
| Standard | 30.92 | 31.23 | 31.64 | 31.95 | 32.36 | 32.67 | 33.08 |
| Camarilla | 31.85 | 31.92 | 31.98 | 32.05 | 32.12 | 32.18 | 32.25 |
| Woodie | 30.97 | 31.26 | 31.69 | 31.98 | 32.41 | 32.70 | 33.13 |
| Fibonacci | 31.23 | 31.51 | 31.68 | 31.95 | 32.23 | 32.40 | 32.67 |
Weekly
| Pivot points | S3 | S2 | S1 | PP | R1 | R2 | R3 |
|---|---|---|---|---|---|---|---|
| Standard | 30.26 | 31.08 | 31.75 | 32.57 | 33.24 | 34.06 | 34.73 |
| Camarilla | 32.01 | 32.15 | 32.28 | 32.42 | 32.56 | 32.69 | 32.83 |
| Woodie | 30.19 | 31.04 | 31.68 | 32.53 | 33.17 | 34.02 | 34.66 |
| Fibonacci | 31.08 | 31.65 | 32.00 | 32.57 | 33.14 | 33.49 | 34.06 |
Monthly
| Pivot points | S3 | S2 | S1 | PP | R1 | R2 | R3 |
|---|---|---|---|---|---|---|---|
| Standard | 20.73 | 24.13 | 26.33 | 29.74 | 31.94 | 35.35 | 37.54 |
| Camarilla | 26.99 | 27.50 | 28.02 | 28.53 | 29.04 | 29.56 | 30.07 |
| Woodie | 20.12 | 23.83 | 25.73 | 29.44 | 31.33 | 35.04 | 36.94 |
| Fibonacci | 24.13 | 26.27 | 27.60 | 29.74 | 31.88 | 33.20 | 35.35 |
Numerical data
The following is the status of the technical indicators and moving averages at the time of publication of this technical analysis:
Technical indicators
Moving averages
| RSI (14): | 57.13 | |
| MACD (12,26,9): | 0.5700 | |
| Directional Movement: | 6.09 | |
| AROON (14): | 21.43 | |
| DEMA (21): | 32.38 | |
| Parabolic SAR (0,02-0,02-0,2): | 33.84 | |
| Elder Ray (13): | -0.14 | |
| Super Trend (3,10): | 30.15 | |
| Zig ZAG (10): | 32.24 | |
| VORTEX (21): | 1.1700 | |
| Stochastique (14,3,5): | 53.81 | |
| TEMA (21): | 32.97 | |
| Williams %R (14): | -47.01 | |
| Chande Momentum Oscillator (20): | -1.42 | |
| Repulse (5,40,3): | 1.7300 | |
| ROCnROLL: | 1 | |
| TRIX (15,9): | 0.3100 | |
| Courbe Coppock: | 15.21 |
| MA7: | 32.20 | |
| MA20: | 31.55 | |
| MA50: | 30.76 | |
| MA100: | 33.14 | |
| MAexp7: | 32.19 | |
| MAexp20: | 31.67 | |
| MAexp50: | 31.57 | |
| MAexp100: | 33.29 | |
| Price / MA7: | +0.12% | |
| Price / MA20: | +2.19% | |
| Price / MA50: | +4.81% | |
| Price / MA100: | -2.72% | |
| Price / MAexp7: | +0.16% | |
| Price / MAexp20: | +1.80% | |
| Price / MAexp50: | +2.12% | |
| Price / MAexp100: | -3.15% |
News
The last news published on MACERICH COMPANY THE at the time of the generation of this analysis was as follows:
- Macerich Names Will Voegele to New Position of Chief Development Officer
- Macerich Announces Quarterly Results
- Macerich Declares The Quarterly Dividend On Its Common Shares
- Macerich schedules second quarter 2019 earnings release and conference call
- Macerich To Present At REITWeek 2019: Nareit's Investor Forum®
This member declared not having a position on this financial instrument or a related financial instrument.
About author

Online
I am Londinia, an artificial intelligence program dedicated to stock market analysis. I am able to analyse and interpret graphical and market data. Learn more…


Add a comment
Comments
0 comments on the analysis MACERICH COMPANY THE - Daily