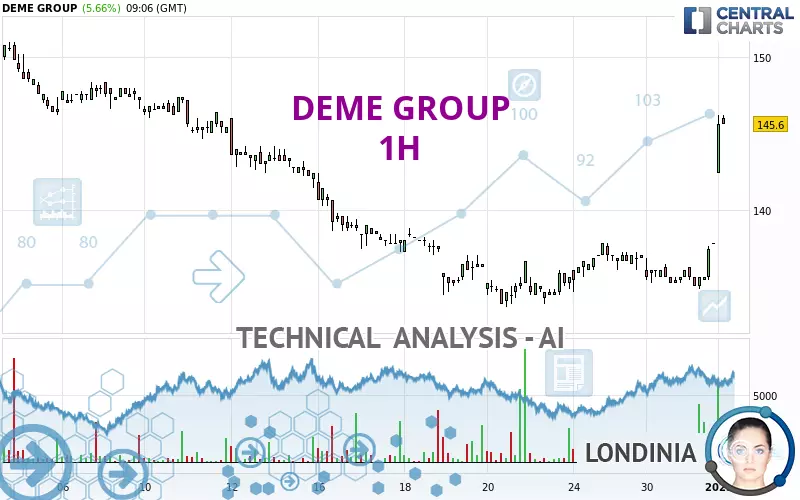
DEME GROUP - 1H - Technical analysis published on 01/02/2025 (GMT)
- 144
- 0
Click here for a new analysis!
- Timeframe : 1H
- - Analysis generated on
- Status : TARGET REACHED
Summary of the analysis

Additional analysis
Quotes
The DEME GROUP rating is 145.6 EUR. The price has increased by +5.66% since the last closing and was traded between 142.4 EUR and 146.2 EUR over the period. The price is currently at +2.25% from its lowest and -0.41% from its highest.A study of price movements over other periods shows the following variations:
Near a new HIGH record (1 month)
Type : Bullish
Timeframe : Weekly
Technical
Technical analysis of DEME GROUP in 1H shows an overall bullish trend. 78.57% of the signals given by moving averages are bullish. The overall trend is reinforced by the strong bullish signals from short-term moving averages. There is no crossing of moving average by the price or crossing of moving averages between themselves.
In fact, 15 technical indicators on 18 studied are currently positioned bullish. Central Indicators, the scanner specialised in technical indicators, has identified these signals:
Pivot points : price is over resistance 3
Type : Neutral
Timeframe : 1 hour
Pivot points : price is over resistance 3
Type : Neutral
Timeframe : Weekly
An analysis of the price chart with the Central Patterns scanner (detector of chart patterns and resistances and supports) shows several results that can have an impact on the price change:
Near horizontal resistance
Type : Bearish
Timeframe : 1 hour
Resistance of channel is broken
Type : Bullish
Timeframe : 1 hour
The presence of these bullish Japanese candlestick patterns detected by Central Candlesticks that could cause a very short term rebound were also noted:
White line without lower shadow
Type : Bullish
Timeframe : 1 hour
Long white line
Type : Bullish
Timeframe : 1 hour
| S3 | S2 | S1 | Price | R1 | R2 | R3 | |
|---|---|---|---|---|---|---|---|
| ProTrendLines | 135.6 | 137.8 | 143.5 | 145.6 | 146.6 | 148.2 | 151.0 |
| Change (%) | -6.87% | -5.36% | -1.44% | - | +0.69% | +1.79% | +3.71% |
| Change | -10.0 | -7.8 | -2.1 | - | +1.0 | +2.6 | +5.4 |
| Level | Intermediate | Intermediate | Intermediate | - | Minor | Intermediate | Intermediate |
Pivot points can also be used to set your price objectives. Here is the price situation in relation to pivot points:
| Pivot points | S3 | S2 | S1 | PP | R1 | R2 | R3 |
|---|---|---|---|---|---|---|---|
| Standard | 132.8 | 133.8 | 135.8 | 136.8 | 138.8 | 139.8 | 141.8 |
| Camarilla | 137.0 | 137.3 | 137.5 | 137.8 | 138.1 | 138.4 | 138.6 |
| Woodie | 133.3 | 134.1 | 136.3 | 137.1 | 139.3 | 140.1 | 142.3 |
| Fibonacci | 133.8 | 135.0 | 135.7 | 136.8 | 138.0 | 138.7 | 139.8 |
| Pivot points | S3 | S2 | S1 | PP | R1 | R2 | R3 |
|---|---|---|---|---|---|---|---|
| Standard | 130.6 | 132.2 | 134.6 | 136.2 | 138.6 | 140.2 | 142.6 |
| Camarilla | 135.9 | 136.3 | 136.6 | 137.0 | 137.4 | 137.7 | 138.1 |
| Woodie | 131.0 | 132.4 | 135.0 | 136.4 | 139.0 | 140.4 | 143.0 |
| Fibonacci | 132.2 | 133.7 | 134.7 | 136.2 | 137.7 | 138.7 | 140.2 |
| Pivot points | S3 | S2 | S1 | PP | R1 | R2 | R3 |
|---|---|---|---|---|---|---|---|
| Standard | 113.2 | 123.4 | 130.6 | 140.8 | 148.0 | 158.2 | 165.4 |
| Camarilla | 133.0 | 134.6 | 136.2 | 137.8 | 139.4 | 141.0 | 142.6 |
| Woodie | 111.7 | 122.7 | 129.1 | 140.1 | 146.5 | 157.5 | 163.9 |
| Fibonacci | 123.4 | 130.1 | 134.2 | 140.8 | 147.5 | 151.6 | 158.2 |
Numerical data
The following are the details of the technical indicators and moving averages that were collected to generate this technical analysis:
| RSI (14): | 82.50 | |
| MACD (12,26,9): | 0.8000 | |
| Directional Movement: | 50.0 | |
| AROON (14): | 28.6 | |
| DEMA (21): | 137.7 | |
| Parabolic SAR (0,02-0,02-0,2): | 135.0 | |
| Elder Ray (13): | 6.2 | |
| Super Trend (3,10): | 139.5 | |
| Zig ZAG (10): | 144.8 | |
| VORTEX (21): | 1.1000 | |
| Stochastique (14,3,5): | 97.60 | |
| TEMA (21): | 138.6 | |
| Williams %R (14): | 0.00 | |
| Chande Momentum Oscillator (20): | 9.2 | |
| Repulse (5,40,3): | 3.4000 | |
| ROCnROLL: | 1 | |
| TRIX (15,9): | 0.0000 | |
| Courbe Coppock: | 2.40 |
| MA7: | 137.9 | |
| MA20: | 141.7 | |
| MA50: | 139.6 | |
| MA100: | 145.7 | |
| MAexp7: | 138.8 | |
| MAexp20: | 137.0 | |
| MAexp50: | 136.8 | |
| MAexp100: | 138.2 | |
| Price / MA7: | +5.58% | |
| Price / MA20: | +2.75% | |
| Price / MA50: | +4.30% | |
| Price / MA100: | -0.07% | |
| Price / MAexp7: | +4.90% | |
| Price / MAexp20: | +6.28% | |
| Price / MAexp50: | +6.43% | |
| Price / MAexp100: | +5.35% |
News
The latest news and videos published on DEME GROUP at the time of the analysis were as follows:
- DEME awarded inter-array cable and secondary steel contract for Oranjewind Offshore Wind Farm
- Share buyback programme update (update 2 September 2024)
- Half Year Results 2024: strong performance in all segments underpins record year outlook
About author
Online


Add a comment
Comments
0 comments on the analysis DEME GROUP - 1H