AB INBEV - 1H - Technical analysis published on 01/17/2025 (GMT)
- 113
- 0
- Timeframe : 1H
- - Analysis generated on
- Status : NEUTRAL

Summary of the analysis

Additional analysis
Quotes
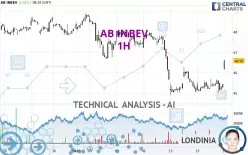
The AB INBEV price is 46.58 EUR. On the day, this instrument gained +2.51% and was between 46.14 EUR and 46.63 EUR. This implies that the price is at +0.95% from its lowest and at -0.11% from its highest.A bullish gap was detected at the opening by the Central Gaps scanner. There are a lot of buyers and they have the upper hand in the very short term.
Opening Gap UP
Type : Bullish
Timeframe : Openning
Here is a more detailed summary of the historical variations registered by AB INBEV:
Near a new LOW record (1 year)
Type : Bearish
Timeframe : Weekly
Near a new LOW record (1st january)
Type : Bearish
Timeframe : Weekly
Near a new LOW record (1 month)
Type : Bearish
Timeframe : Weekly
Technical
A technical analysis in 1H of this AB INBEV chart shows a bearish trend. The signals given by the moving averages are at 64.29% bearish. This bearish trend could quickly slow down given the strong bullish signals currently being given by short-term moving averages. An assessment of moving averages reveals several bullish signals that could impact this trend:
Bullish trend reversal : Moving Average 20
Type : Bullish
Timeframe : 1 hour
Bullish trend reversal : adaptative moving average 20
Type : Bullish
Timeframe : 1 hour
Bullish price crossover with Moving Average 50
Type : Bullish
Timeframe : 1 hour
Bullish price crossover with adaptative moving average 50
Type : Bullish
Timeframe : 1 hour
Bullish price crossover with adaptative moving average 100
Type : Bullish
Timeframe : 1 hour
The probability of a further increase is slight given the direction of the technical indicators.
Caution: the Central Indicators scanner currently detects an excess:
CCI indicator is overbought : over 100
Type : Neutral
Timeframe : 1 hour
Williams %R indicator is overbought : over -20
Type : Neutral
Timeframe : 1 hour
Pivot points : price is over resistance 3
Type : Neutral
Timeframe : 1 hour
RSI indicator is back over 50
Type : Bullish
Timeframe : 1 hour
Parabolic SAR indicator bullish reversal
Type : Bullish
Timeframe : 1 hour
Aroon indicator bullish trend
Type : Bullish
Timeframe : 1 hour
Ichimoku : price is over the cloud
Type : Bullish
Timeframe : 1 hour
SuperTrend indicator bullish reversal
Type : Bullish
Timeframe : 1 hour
Price is back over the pivot point
Type : Bullish
Timeframe : Weekly
Momentum indicator is back over 0
Type : Bullish
Timeframe : 1 hour
The Central Patterns scanner, which studies chart patterns, resistances and supports, has identified this signal:
Near resistance of channel
Type : Bearish
Timeframe : 1 hour
For a small rebound in the very short term, the Central Candlesticks scanner currently notes the presence of this bullish pattern in Japanese candlesticks:
Upside gap
Type : Bullish
Timeframe : 1 hour
| S3 | S2 | S1 | Price | R1 | R2 | R3 | |
|---|---|---|---|---|---|---|---|
| ProTrendLines | 9.68 | 29.44 | 45.29 | 46.58 | 46.66 | 47.38 | 48.77 |
| Change (%) | -79.22% | -36.80% | -2.77% | - | +0.17% | +1.72% | +4.70% |
| Change | -36.90 | -17.14 | -1.29 | - | +0.08 | +0.80 | +2.19 |
| Level | Minor | Major | Major | - | Minor | Intermediate | Intermediate |
To determine price objectives, it is also possible to use the pivot points. Here is the price position in relation to pivot points:
| Pivot points | S3 | S2 | S1 | PP | R1 | R2 | R3 |
|---|---|---|---|---|---|---|---|
| Standard | 44.44 | 44.73 | 45.09 | 45.38 | 45.74 | 46.03 | 46.39 |
| Camarilla | 45.26 | 45.32 | 45.38 | 45.44 | 45.50 | 45.56 | 45.62 |
| Woodie | 44.47 | 44.75 | 45.12 | 45.40 | 45.77 | 46.05 | 46.42 |
| Fibonacci | 44.73 | 44.98 | 45.14 | 45.38 | 45.63 | 45.79 | 46.03 |
| Pivot points | S3 | S2 | S1 | PP | R1 | R2 | R3 |
|---|---|---|---|---|---|---|---|
| Standard | 42.34 | 44.00 | 44.82 | 46.48 | 47.30 | 48.96 | 49.78 |
| Camarilla | 44.97 | 45.20 | 45.42 | 45.65 | 45.88 | 46.11 | 46.33 |
| Woodie | 41.93 | 43.79 | 44.41 | 46.27 | 46.89 | 48.75 | 49.37 |
| Fibonacci | 44.00 | 44.94 | 45.53 | 46.48 | 47.42 | 48.01 | 48.96 |
| Pivot points | S3 | S2 | S1 | PP | R1 | R2 | R3 |
|---|---|---|---|---|---|---|---|
| Standard | 42.81 | 45.27 | 46.76 | 49.22 | 50.71 | 53.17 | 54.66 |
| Camarilla | 47.16 | 47.53 | 47.89 | 48.25 | 48.61 | 48.97 | 49.34 |
| Woodie | 42.33 | 45.03 | 46.28 | 48.98 | 50.23 | 52.93 | 54.18 |
| Fibonacci | 45.27 | 46.78 | 47.71 | 49.22 | 50.73 | 51.66 | 53.17 |
Numerical data
The following are the details of the technical indicators and moving averages that were collected to generate this technical analysis:
| RSI (14): | 48.21 | |
| MACD (12,26,9): | -0.1200 | |
| Directional Movement: | 2.76 | |
| AROON (14): | -35.71 | |
| DEMA (21): | 45.21 | |
| Parabolic SAR (0,02-0,02-0,2): | 45.87 | |
| Elder Ray (13): | -0.04 | |
| Super Trend (3,10): | 45.91 | |
| Zig ZAG (10): | 45.44 | |
| VORTEX (21): | 0.9100 | |
| Stochastique (14,3,5): | 40.51 | |
| TEMA (21): | 45.38 | |
| Williams %R (14): | -36.92 | |
| Chande Momentum Oscillator (20): | -0.06 | |
| Repulse (5,40,3): | 0.4600 | |
| ROCnROLL: | -1 | |
| TRIX (15,9): | -0.0500 | |
| Courbe Coppock: | 0.50 |
| MA7: | 45.81 | |
| MA20: | 47.50 | |
| MA50: | 50.15 | |
| MA100: | 54.16 | |
| MAexp7: | 45.59 | |
| MAexp20: | 45.42 | |
| MAexp50: | 45.89 | |
| MAexp100: | 46.64 | |
| Price / MA7: | +1.68% | |
| Price / MA20: | -1.94% | |
| Price / MA50: | -7.12% | |
| Price / MA100: | -14.00% | |
| Price / MAexp7: | +2.17% | |
| Price / MAexp20: | +2.55% | |
| Price / MAexp50: | +1.50% | |
| Price / MAexp100: | -0.13% |
News
Don't forget to follow the news on AB INBEV. At the time of publication of this analysis, the latest news was as follows:
- AB InBev Becomes Official Beer Partner of FIFA Club World Cup 2025™
- Corona Cero’s Relaxation Clause Brings a Fresh Perspective to Athlete Partnerships
-
 Look ahead: PCE; GDP; Ocado; Best Buy; AB-InBev
-
AB InBev makes big move after Dylan Mulvaney controversy #shorts
- AB InBev and South Pole Partner To Accelerate Supply Chain Decarbonisation Across Europe Through Launch of a Renewable Electricity Group Buying Initiative
About author
Online


Add a comment
Comments
0 comments on the analysis AB INBEV - 1H