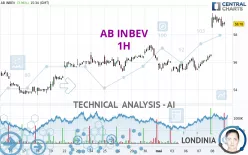
AB INBEV - 1H - Technical analysis published on 05/09/2024 (GMT)
- 151
- 0
Click here for a new analysis!
- Timeframe : 1H
- - Analysis generated on
- Status : TARGET REACHED

Summary of the analysis

Additional analysis
Quotes
The AB INBEV price is 58.78 EUR. The price has increased by +3.96% since the last closing with the lowest point at 58.50 EUR and the highest point at 59.56 EUR. The deviation from the price is +0.48% for the low point and -1.31% for the high point.The Central Gaps scanner detects the formation of a bullish gap marking the strong presence of buyers against sellers at the opening. This formed a quotation gap.
Opening Gap UP
Type : Bullish
Timeframe : Openning
So that you have an overall view of the price change, here is a table showing the variations over several periods:
Near a new HIGH record (1 year)
Type : Bullish
Timeframe : Weekly
Near a new HIGH record (1st january)
Type : Bullish
Timeframe : Weekly
New HIGH record (1 month)
Type : Bullish
Timeframe : Weekly
Technical
A technical analysis in 1H of this AB INBEV chart shows a strongly bullish trend. 92.86% of the signals given by moving averages are bullish. This strongly bullish trend is supported by the strong bullish signals given by short-term moving averages. The Central Indicators scanner does not detect any result on moving averages that would impact this trend.
In fact, 11 technical indicators on 18 studied are currently bullish. Central Indicators, the scanner specialised in technical indicators, has identified these signals:
Pivot points : price is over resistance 3
Type : Neutral
Timeframe : 1 hour
Pivot points : price is over resistance 3
Type : Neutral
Timeframe : Weekly
Central Patterns, the scanner specializing in chart patterns, did not identify any signals.
The Central Candlesticks scanner which studies Japanese candlesticks did not detect anything.
| S3 | S2 | S1 | Price | R1 | R2 | R3 | |
|---|---|---|---|---|---|---|---|
| ProTrendLines | 55.43 | 56.43 | 57.36 | 58.78 | 59.46 | 62.96 | 86.74 |
| Change (%) | -5.70% | -4.00% | -2.42% | - | +1.16% | +7.11% | +47.57% |
| Change | -3.35 | -2.35 | -1.42 | - | +0.68 | +4.18 | +27.96 |
| Level | Intermediate | Major | Minor | - | Major | Minor | Minor |
Attention could also be paid to pivot points to set price objectives:
| Pivot points | S3 | S2 | S1 | PP | R1 | R2 | R3 |
|---|---|---|---|---|---|---|---|
| Standard | 57.27 | 57.89 | 58.33 | 58.95 | 59.39 | 60.01 | 60.45 |
| Camarilla | 58.49 | 58.59 | 58.68 | 58.78 | 58.88 | 58.97 | 59.07 |
| Woodie | 57.19 | 57.85 | 58.25 | 58.91 | 59.31 | 59.97 | 60.37 |
| Fibonacci | 57.89 | 58.29 | 58.54 | 58.95 | 59.35 | 59.60 | 60.01 |
| Pivot points | S3 | S2 | S1 | PP | R1 | R2 | R3 |
|---|---|---|---|---|---|---|---|
| Standard | 52.76 | 53.67 | 54.59 | 55.50 | 56.42 | 57.33 | 58.25 |
| Camarilla | 55.02 | 55.19 | 55.35 | 55.52 | 55.69 | 55.86 | 56.02 |
| Woodie | 52.78 | 53.67 | 54.61 | 55.50 | 56.44 | 57.33 | 58.27 |
| Fibonacci | 53.67 | 54.37 | 54.80 | 55.50 | 56.20 | 56.63 | 57.33 |
| Pivot points | S3 | S2 | S1 | PP | R1 | R2 | R3 |
|---|---|---|---|---|---|---|---|
| Standard | 49.71 | 51.26 | 53.30 | 54.85 | 56.89 | 58.44 | 60.48 |
| Camarilla | 54.35 | 54.68 | 55.01 | 55.34 | 55.67 | 56.00 | 56.33 |
| Woodie | 49.96 | 51.38 | 53.55 | 54.97 | 57.14 | 58.56 | 60.73 |
| Fibonacci | 51.26 | 52.63 | 53.48 | 54.85 | 56.22 | 57.07 | 58.44 |
Numerical data
The following are the details of the technical indicators and moving averages that were collected to generate this technical analysis:
| RSI (14): | 69.40 | |
| MACD (12,26,9): | 0.8700 | |
| Directional Movement: | 25.59 | |
| AROON (14): | 42.86 | |
| DEMA (21): | 58.83 | |
| Parabolic SAR (0,02-0,02-0,2): | 57.51 | |
| Elder Ray (13): | 0.54 | |
| Super Trend (3,10): | 57.78 | |
| Zig ZAG (10): | 58.78 | |
| VORTEX (21): | 1.0600 | |
| Stochastique (14,3,5): | 77.74 | |
| TEMA (21): | 59.32 | |
| Williams %R (14): | -22.16 | |
| Chande Momentum Oscillator (20): | 2.64 | |
| Repulse (5,40,3): | -0.2900 | |
| ROCnROLL: | 1 | |
| TRIX (15,9): | 0.1900 | |
| Courbe Coppock: | 10.61 |
| MA7: | 56.06 | |
| MA20: | 54.98 | |
| MA50: | 55.18 | |
| MA100: | 56.33 | |
| MAexp7: | 58.70 | |
| MAexp20: | 57.75 | |
| MAexp50: | 56.69 | |
| MAexp100: | 55.98 | |
| Price / MA7: | +4.85% | |
| Price / MA20: | +6.91% | |
| Price / MA50: | +6.52% | |
| Price / MA100: | +4.35% | |
| Price / MAexp7: | +0.14% | |
| Price / MAexp20: | +1.78% | |
| Price / MAexp50: | +3.69% | |
| Price / MAexp100: | +5.00% |
News
The last news published on AB INBEV at the time of the generation of this analysis was as follows:
-
 Look ahead: PCE; GDP; Ocado; Best Buy; AB-InBev
-
AB InBev makes big move after Dylan Mulvaney controversy #shorts
- AB InBev and South Pole Partner To Accelerate Supply Chain Decarbonisation Across Europe Through Launch of a Renewable Electricity Group Buying Initiative
- AB InBev Reports Second Quarter 2023 Results
- Budweiser Global Celebrates 2023 FIFA Women’s World Cup™ with the Return of #BringHomeTheBud
About author
Online


Add a comment
Comments
0 comments on the analysis AB INBEV - 1H