ARCH CAPITAL GROUP - 1H - Technical analysis published on 03/05/2025 (GMT)
- 49
- 0
- Timeframe : 1H
- - Analysis generated on
- Status : NEUTRAL
Summary of the analysis

Additional analysis
Quotes
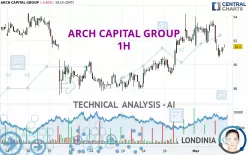
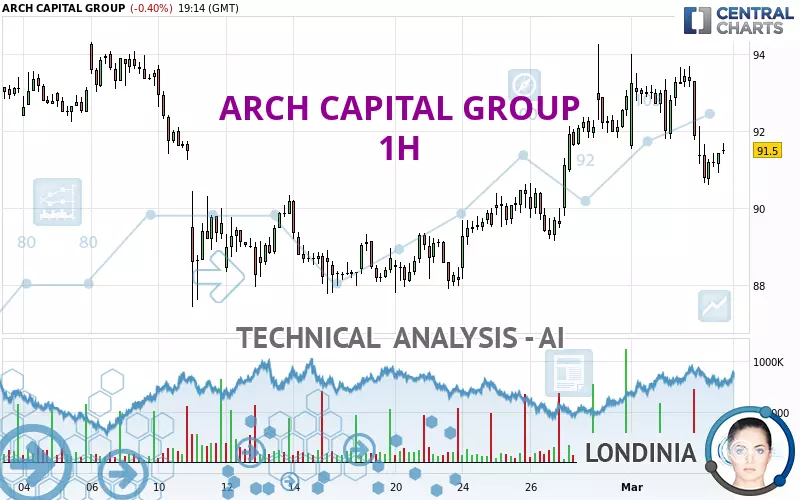
The ARCH CAPITAL GROUP rating is 91.50 USD. On the day, this instrument lost -0.40% with the lowest point at 90.60 USD and the highest point at 92.13 USD. The deviation from the price is +0.99% for the low point and -0.68% for the high point.The Central Gaps scanner detects the formation of a bearish gap marking the strong presence of sellers ahead of buyers at the opening. This formed a quotation gap.
Opening Gap DOWN
Type : Bearish
Timeframe : Openning
A study of price movements over other periods shows the following variations:
Near a new LOW record (1st january)
Type : Bearish
Timeframe : Weekly
Near a new LOW record (1 month)
Type : Bearish
Timeframe : Weekly
Technical
Technical analysis of this 1H chart of ARCH CAPITAL GROUP indicates that the overall trend is slightly bullish. 60.71% of the signals given by moving averages are bullish. Caution: the slightly bearish signals currently given by short-term moving averages indicate that the overall trend could be reversed. There is no crossing of moving average by the price or crossing of moving averages between themselves.
On the 18 technical indicators analysed, 4 are bullish, 6 are neutral and 8 are bearish. The Central Indicators scanner specialised in technical indicators, has not detected anything further.
Central Patterns, the market scanner focusing on chart patterns, resistances and supports found these results:
Near horizontal support
Type : Bullish
Timeframe : 1 hour
Support of channel is broken
Type : Bearish
Timeframe : 1 hour
From the Japanese candlestick perspective, the Central Candlesticks scanner notes the presence of these results that could impact the short-term trend:
White hanging man / hammer
Type : Neutral
Timeframe : 1 hour
Bearish doji star
Type : Bearish
Timeframe : 1 hour
Bullish engulfing lines
Type : Bullish
Timeframe : 1 hour
Doji
Type : Neutral
Timeframe : 1 hour
| S3 | S2 | S1 | Price | R1 | R2 | R3 | |
|---|---|---|---|---|---|---|---|
| ProTrendLines | 87.80 | 88.71 | 90.33 | 91.50 | 91.52 | 92.85 | 94.29 |
| Change (%) | -4.04% | -3.05% | -1.28% | - | +0.02% | +1.48% | +3.05% |
| Change | -3.70 | -2.79 | -1.17 | - | +0.02 | +1.35 | +2.79 |
| Level | Major | Major | Minor | - | Minor | Minor | Major |
To determine price objectives, it is also possible to use the pivot points. Here is the price position in relation to pivot points:
| Pivot points | S3 | S2 | S1 | PP | R1 | R2 | R3 |
|---|---|---|---|---|---|---|---|
| Standard | 89.29 | 90.52 | 91.20 | 92.43 | 93.11 | 94.34 | 95.02 |
| Camarilla | 91.35 | 91.52 | 91.70 | 91.87 | 92.05 | 92.22 | 92.40 |
| Woodie | 89.01 | 90.38 | 90.92 | 92.29 | 92.83 | 94.20 | 94.74 |
| Fibonacci | 90.52 | 91.25 | 91.70 | 92.43 | 93.16 | 93.61 | 94.34 |
| Pivot points | S3 | S2 | S1 | PP | R1 | R2 | R3 |
|---|---|---|---|---|---|---|---|
| Standard | 83.18 | 85.66 | 89.29 | 91.77 | 95.40 | 97.88 | 101.51 |
| Camarilla | 91.23 | 91.79 | 92.35 | 92.91 | 93.47 | 94.03 | 94.59 |
| Woodie | 83.75 | 85.95 | 89.86 | 92.06 | 95.97 | 98.17 | 102.08 |
| Fibonacci | 85.66 | 88.00 | 89.44 | 91.77 | 94.11 | 95.55 | 97.88 |
| Pivot points | S3 | S2 | S1 | PP | R1 | R2 | R3 |
|---|---|---|---|---|---|---|---|
| Standard | 81.91 | 84.66 | 88.79 | 91.54 | 95.67 | 98.42 | 102.55 |
| Camarilla | 91.02 | 91.65 | 92.28 | 92.91 | 93.54 | 94.17 | 94.80 |
| Woodie | 82.59 | 85.01 | 89.47 | 91.89 | 96.35 | 98.77 | 103.23 |
| Fibonacci | 84.66 | 87.29 | 88.92 | 91.54 | 94.17 | 95.80 | 98.42 |
Numerical data
The following is the status of technical indicators and moving averages registered at the time this technical analysis was created:
| RSI (14): | 42.82 | |
| MACD (12,26,9): | -0.1100 | |
| Directional Movement: | -10.59 | |
| AROON (14): | -28.57 | |
| DEMA (21): | 92.05 | |
| Parabolic SAR (0,02-0,02-0,2): | 93.16 | |
| Elder Ray (13): | -0.79 | |
| Super Trend (3,10): | 93.34 | |
| Zig ZAG (10): | 91.38 | |
| VORTEX (21): | 0.9400 | |
| Stochastique (14,3,5): | 24.17 | |
| TEMA (21): | 91.43 | |
| Williams %R (14): | -69.59 | |
| Chande Momentum Oscillator (20): | -0.49 | |
| Repulse (5,40,3): | 0.1900 | |
| ROCnROLL: | -1 | |
| TRIX (15,9): | 0.0300 | |
| Courbe Coppock: | 2.71 |
| MA7: | 91.61 | |
| MA20: | 90.63 | |
| MA50: | 91.93 | |
| MA100: | 95.06 | |
| MAexp7: | 91.56 | |
| MAexp20: | 92.00 | |
| MAexp50: | 91.53 | |
| MAexp100: | 91.14 | |
| Price / MA7: | -0.12% | |
| Price / MA20: | +0.96% | |
| Price / MA50: | -0.47% | |
| Price / MA100: | -3.75% | |
| Price / MAexp7: | -0.07% | |
| Price / MAexp20: | -0.54% | |
| Price / MAexp50: | -0.03% | |
| Price / MAexp100: | +0.39% |
About author
Online


Add a comment
Comments
0 comments on the analysis ARCH CAPITAL GROUP - 1H