| Open: | 7.68 |
| Change: | -0.07 |
| Volume: | 924,539 |
| Low: | 7.57 |
| High: | 7.68 |
| High / Low range: | 0.11 |
| Type: | Stocks |
| Ticker: | LOW |
| ISIN: |
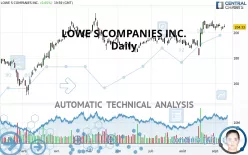
LOWE S COMPANIES INC. - Daily - Technical analysis published on 09/12/2021 (GMT)
- 309
- 0
- 09/12/2021 - 20:27
Click here for a new analysis!
- Timeframe : Daily
- - Analysis generated on 09/12/2021 - 20:27
- Status : TARGET REACHED

Summary of the analysis

Additional analysis
Quotes
LOWE S COMPANIES INC. rating 204.33 USD. The price has increased by +0.65% since the last closing with the lowest point at 204.16 USD and the highest point at 206.58 USD. The deviation from the price is +0.08% for the low point and -1.09% for the high point.The Central Gaps scanner detects the formation of a bullish gap marking the strong presence of buyers against sellers at the opening. This formed a quotation gap.
Opening Gap UP
Type : Bullish
Timeframe : Openning
A study of price movements over other periods shows the following variations:
Near a new HIGH record (5 years)
Type : Bullish
Timeframe : Weekly
Near a new HIGH record (1 year)
Type : Bullish
Timeframe : Weekly
Near a new HIGH record (1st january)
Type : Bullish
Timeframe : Weekly
Near a new HIGH record (1 month)
Type : Bullish
Timeframe : Weekly
Technical
A technical analysis in Daily of this LOWE S COMPANIES INC. chart shows a strongly bullish trend. The signals given by the moving averages are 92.86% bullish. This strong bullish trend is confirmed by the strong signals currently being given by short-term moving averages. The Central Indicators market scanner currently does not detect any result that concerns moving averages.
In fact, of the 18 technical indicators analysed by Central Analyzer, 9 are bullish, 4 are neutral and 5 are bearish. Caution: the Central Indicators scanner currently detects an excess:
Williams %R indicator is oversold : under -80
Type : Neutral
Timeframe : Daily
Pivot points : price is over resistance 1
Type : Neutral
Timeframe : Daily
MACD crosses DOWN its Moving Average
Type : Bearish
Timeframe : Daily
Price is back under the pivot point
Type : Bearish
Timeframe : Daily
Williams %R indicator is back under -50
Type : Bearish
Timeframe : Daily
Central Patterns, the scanner specializing in chart patterns, did not identify any signals.
The Central Candlesticks scanner, specialised in Japanese candlesticks, did not identify any signals.
| S3 | S2 | S1 | Price | R1 | |
|---|---|---|---|---|---|
| ProTrendLines | 186.20 | 196.02 | 203.43 | 204.33 | 211.31 |
| Change (%) | -8.87% | -4.07% | -0.44% | - | +3.42% |
| Change | -18.13 | -8.31 | -0.90 | - | +6.98 |
| Level | Major | Major | Major | - | Major |
Pivot points can also be used to set your price objectives. Here is the price situation in relation to pivot points:
| Pivot points | S3 | S2 | S1 | PP | R1 | R2 | R3 |
|---|---|---|---|---|---|---|---|
| Standard | 201.16 | 202.70 | 203.51 | 205.05 | 205.86 | 207.40 | 208.21 |
| Camarilla | 203.68 | 203.90 | 204.12 | 204.33 | 204.55 | 204.76 | 204.98 |
| Woodie | 200.81 | 202.52 | 203.16 | 204.87 | 205.51 | 207.22 | 207.86 |
| Fibonacci | 202.70 | 203.59 | 204.15 | 205.05 | 205.94 | 206.50 | 207.40 |
| Pivot points | S3 | S2 | S1 | PP | R1 | R2 | R3 |
|---|---|---|---|---|---|---|---|
| Standard | 195.73 | 198.62 | 201.47 | 204.36 | 207.21 | 210.10 | 212.95 |
| Camarilla | 202.75 | 203.28 | 203.80 | 204.33 | 204.86 | 205.38 | 205.91 |
| Woodie | 195.72 | 198.61 | 201.46 | 204.35 | 207.20 | 210.09 | 212.94 |
| Fibonacci | 198.62 | 200.81 | 202.16 | 204.36 | 206.55 | 207.90 | 210.10 |
| Pivot points | S3 | S2 | S1 | PP | R1 | R2 | R3 |
|---|---|---|---|---|---|---|---|
| Standard | 160.07 | 171.08 | 187.48 | 198.49 | 214.89 | 225.90 | 242.30 |
| Camarilla | 196.35 | 198.87 | 201.38 | 203.89 | 206.40 | 208.92 | 211.43 |
| Woodie | 162.78 | 172.43 | 190.19 | 199.84 | 217.60 | 227.25 | 245.01 |
| Fibonacci | 171.08 | 181.55 | 188.02 | 198.49 | 208.96 | 215.43 | 225.90 |
Numerical data
The following are the details of the technical indicators and moving averages that were collected to generate this technical analysis:
| RSI (14): | 55.98 | |
| MACD (12,26,9): | 2.6000 | |
| Directional Movement: | 7.78 | |
| AROON (14): | -78.57 | |
| DEMA (21): | 205.75 | |
| Parabolic SAR (0,02-0,02-0,2): | 197.89 | |
| Elder Ray (13): | 1.81 | |
| Super Trend (3,10): | 193.89 | |
| Zig ZAG (10): | 204.33 | |
| VORTEX (21): | 1.0300 | |
| Stochastique (14,3,5): | 35.12 | |
| TEMA (21): | 206.55 | |
| Williams %R (14): | -64.58 | |
| Chande Momentum Oscillator (20): | 0.94 | |
| Repulse (5,40,3): | -1.2200 | |
| ROCnROLL: | 1 | |
| TRIX (15,9): | 0.2200 | |
| Courbe Coppock: | 5.72 |
| MA7: | 204.59 | |
| MA20: | 202.25 | |
| MA50: | 196.99 | |
| MA100: | 195.49 | |
| MAexp7: | 204.29 | |
| MAexp20: | 202.21 | |
| MAexp50: | 198.21 | |
| MAexp100: | 193.74 | |
| Price / MA7: | -0.13% | |
| Price / MA20: | +1.03% | |
| Price / MA50: | +3.73% | |
| Price / MA100: | +4.52% | |
| Price / MAexp7: | +0.02% | |
| Price / MAexp20: | +1.05% | |
| Price / MAexp50: | +3.09% | |
| Price / MAexp100: | +5.47% |
News
The latest news and videos published on LOWE S COMPANIES INC. at the time of the analysis were as follows:
- 09/02/2021 - 13:00 Lowe's to Present at Goldman Sachs 28th Annual Global Retailing Conference
-
08/31/2021 - 16:15
 The DIY Boom And The Rise Of Lowe’s
- 08/30/2021 - 16:00 Lowe's Pledges $2 Million In Wake Of Hurricane Ida To Support Relief Efforts
- 08/27/2021 - 20:30 Lowe's Companies, Inc. Declares Cash Dividend
- 08/23/2021 - 04:01 Lowe's Unites Creator Collective And Project Matchmaking Program To Help Us All #FallTogether
About author

Online


Add a comment
Comments
0 comments on the analysis LOWE S COMPANIES INC. - Daily