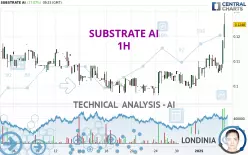
SUBSTRATE AI - 1H - Technical analysis published on 01/06/2025 (GMT)
- 103
- 0
Click here for a new analysis!
- Timeframe : 1H
- - Analysis generated on
- Status : INVALID

Summary of the analysis

Additional analysis
Quotes
The SUBSTRATE AI rating is 0.1248 EUR. The price registered an increase of +17.07% on the session and was traded between 0.1072 EUR and 0.1294 EUR over the period. The price is currently at +16.42% from its lowest and -3.55% from its highest.Here is a more detailed summary of the historical variations registered by SUBSTRATE AI:
New HIGH record (1st january)
Type : Bullish
Timeframe : Weekly
Technical
A technical analysis in 1H of this SUBSTRATE AI chart shows a strongly bullish trend. 89.29% of the signals given by moving averages are bullish. The overall trend is supported by the strong bullish signals from short-term moving averages. The Central Indicators scanner detects a bullish signal on moving averages that could impact this trend:
Moving Average bullish crossovers : AMA20 & AMA50
Type : Bullish
Timeframe : 1 hour
The probability of a further increase is high given the direction of the technical indicators.
Central Indicators, the detector scanner for these technical indicators has recently detected several signals:
Pivot points : price is over resistance 1
Type : Neutral
Timeframe : Weekly
Pivot points : price is over resistance 3
Type : Neutral
Timeframe : 1 hour
The Central Patterns scanner, which studies chart patterns, resistances and supports, has identified these signals:
Near resistance of triangle
Type : Bearish
Timeframe : 1 hour
Near horizontal support
Type : Bullish
Timeframe : 1 hour
Near support of channel
Type : Bullish
Timeframe : 1 hour
From the Japanese candlestick perspective, the Central Candlesticks scanner notes the presence of these results that could impact the short-term trend:
White gravestone / inverted hammer
Type : Neutral
Timeframe : 1 hour
Upside gap
Type : Bullish
Timeframe : 1 hour
Gravestone doji
Type : Bearish
Timeframe : 1 hour
Long white line
Type : Bullish
Timeframe : 1 hour
| S3 | S2 | S1 | Price | R1 | R2 | R3 | |
|---|---|---|---|---|---|---|---|
| ProTrendLines | 0.1059 | 0.1128 | 0.1224 | 0.1248 | 0.1340 | 0.1409 | 0.1681 |
| Change (%) | -15.14% | -9.62% | -1.92% | - | +7.37% | +12.90% | +34.70% |
| Change | -0.0189 | -0.0120 | -0.0024 | - | +0.0092 | +0.0161 | +0.0433 |
| Level | Intermediate | Intermediate | Intermediate | - | Intermediate | Intermediate | Major |
Attention could also be paid to pivot points to set price objectives:
| Pivot points | S3 | S2 | S1 | PP | R1 | R2 | R3 |
|---|---|---|---|---|---|---|---|
| Standard | 0.0963 | 0.1009 | 0.1037 | 0.1083 | 0.1111 | 0.1157 | 0.1185 |
| Camarilla | 0.1046 | 0.1052 | 0.1059 | 0.1066 | 0.1073 | 0.1080 | 0.1086 |
| Woodie | 0.0955 | 0.1005 | 0.1029 | 0.1079 | 0.1103 | 0.1153 | 0.1177 |
| Fibonacci | 0.1009 | 0.1037 | 0.1054 | 0.1083 | 0.1111 | 0.1128 | 0.1157 |
| Pivot points | S3 | S2 | S1 | PP | R1 | R2 | R3 |
|---|---|---|---|---|---|---|---|
| Standard | 0.0857 | 0.0923 | 0.0995 | 0.1061 | 0.1133 | 0.1199 | 0.1271 |
| Camarilla | 0.1028 | 0.1041 | 0.1053 | 0.1066 | 0.1079 | 0.1091 | 0.1104 |
| Woodie | 0.0859 | 0.0925 | 0.0997 | 0.1063 | 0.1135 | 0.1201 | 0.1273 |
| Fibonacci | 0.0923 | 0.0976 | 0.1009 | 0.1061 | 0.1114 | 0.1147 | 0.1199 |
| Pivot points | S3 | S2 | S1 | PP | R1 | R2 | R3 |
|---|---|---|---|---|---|---|---|
| Standard | 0.0504 | 0.0733 | 0.0881 | 0.1110 | 0.1258 | 0.1487 | 0.1635 |
| Camarilla | 0.0924 | 0.0959 | 0.0993 | 0.1028 | 0.1063 | 0.1097 | 0.1132 |
| Woodie | 0.0463 | 0.0713 | 0.0840 | 0.1090 | 0.1217 | 0.1467 | 0.1594 |
| Fibonacci | 0.0733 | 0.0877 | 0.0966 | 0.1110 | 0.1254 | 0.1343 | 0.1487 |
Numerical data
The following is the status of the technical indicators and moving averages at the time of publication of this technical analysis:
| RSI (14): | 66.07 | |
| MACD (12,26,9): | 0.0019 | |
| Directional Movement: | 7.8134 | |
| AROON (14): | 85.7143 | |
| DEMA (21): | 0.1107 | |
| Parabolic SAR (0,02-0,02-0,2): | 0.1054 | |
| Elder Ray (13): | 0.0034 | |
| Super Trend (3,10): | 0.1025 | |
| Zig ZAG (10): | 0.1184 | |
| VORTEX (21): | 0.9633 | |
| Stochastique (14,3,5): | 63.12 | |
| TEMA (21): | 0.1116 | |
| Williams %R (14): | 0.00 | |
| Chande Momentum Oscillator (20): | 0.0108 | |
| Repulse (5,40,3): | 10.6336 | |
| ROCnROLL: | 1 | |
| TRIX (15,9): | 0.2304 | |
| Courbe Coppock: | 7.92 |
| MA7: | 0.1071 | |
| MA20: | 0.1065 | |
| MA50: | 0.1089 | |
| MA100: | 0.1113 | |
| MAexp7: | 0.1134 | |
| MAexp20: | 0.1083 | |
| MAexp50: | 0.1059 | |
| MAexp100: | 0.1060 | |
| Price / MA7: | +16.53% | |
| Price / MA20: | +17.18% | |
| Price / MA50: | +14.60% | |
| Price / MA100: | +12.13% | |
| Price / MAexp7: | +10.05% | |
| Price / MAexp20: | +15.24% | |
| Price / MAexp50: | +17.85% | |
| Price / MAexp100: | +17.74% |
About author
Online


Add a comment
Comments
0 comments on the analysis SUBSTRATE AI - 1H