ANALOG DEVICES INC. - 1H - Technical analysis published on 02/16/2024 (GMT)
- 225
- 0
Click here for a new analysis!
- Timeframe : 1H
- - Analysis generated on
- Status : INVALID
Summary of the analysis

Additional analysis
Quotes
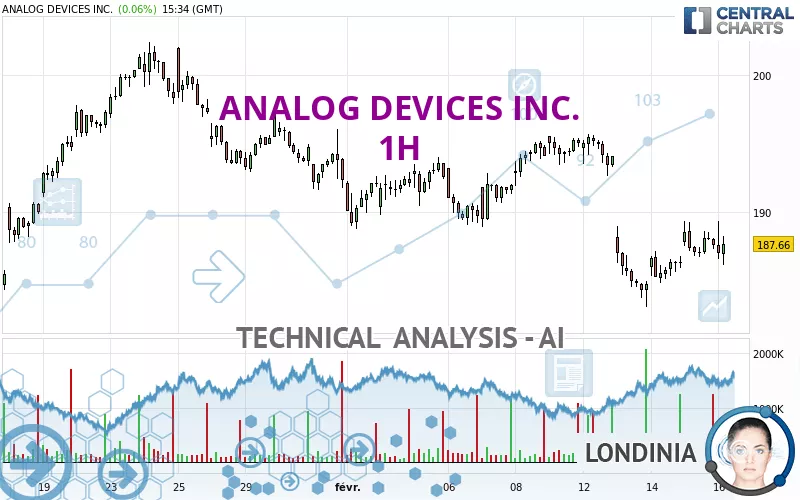
The ANALOG DEVICES INC. price is 187.44 USD. On the day, this instrument lost -0.05% and was traded between 186.06 USD and 189.33 USD over the period. The price is currently at +0.74% from its lowest and -1.00% from its highest.A study of price movements over other periods shows the following variations:
Near a new HIGH record (5 years)
Type : Bullish
Timeframe : Weekly
Near a new LOW record (1st january)
Type : Bearish
Timeframe : Weekly
Near a new LOW record (1 month)
Type : Bearish
Timeframe : Weekly
Technical
Technical analysis of ANALOG DEVICES INC. in 1H shows an overall bearish trend. The signals given by moving averages are 78.57% bearish. This bearish trend could slow down given the neutral signals currently being given by short-term moving averages. The Central Indicators scanner detects a bullish signal on moving averages that could impact this trend:
Bullish price crossover with adaptative moving average 20
Type : Bullish
Timeframe : 1 hour
In fact, only 9 technical indicators out of 18 studied are currently positioned bullish. Other results related to technical indicators were also found by the Central Indicators scanner:
Pivot points : price is under support 1
Type : Neutral
Timeframe : Weekly
Price is back over the pivot point
Type : Bullish
Timeframe : 1 hour
Williams %R indicator is back over -50
Type : Bullish
Timeframe : 1 hour
The Central Patterns scanner, which studies chart patterns, resistances and supports, has identified these signals:
Near horizontal resistance
Type : Bearish
Timeframe : 1 hour
Resistance of channel is broken
Type : Bullish
Timeframe : 1 hour
The presence of a bullish Japanese candlestick pattern detected by Central Candlesticks that could cause a very short term rebound was also detected:
Bullish engulfing lines
Type : Bullish
Timeframe : 1 hour
| S3 | S2 | S1 | Price | R1 | R2 | R3 | |
|---|---|---|---|---|---|---|---|
| ProTrendLines | 181.15 | 182.94 | 185.43 | 187.44 | 189.65 | 192.86 | 195.65 |
| Change (%) | -3.36% | -2.40% | -1.07% | - | +1.18% | +2.89% | +4.38% |
| Change | -6.29 | -4.50 | -2.01 | - | +2.21 | +5.42 | +8.21 |
| Level | Major | Intermediate | Major | - | Major | Minor | Intermediate |
Attention could also be paid to pivot points to set price objectives:
| Pivot points | S3 | S2 | S1 | PP | R1 | R2 | R3 |
|---|---|---|---|---|---|---|---|
| Standard | 183.74 | 185.21 | 186.38 | 187.85 | 189.02 | 190.49 | 191.66 |
| Camarilla | 186.81 | 187.06 | 187.30 | 187.54 | 187.78 | 188.02 | 188.27 |
| Woodie | 183.58 | 185.14 | 186.22 | 187.78 | 188.86 | 190.42 | 191.50 |
| Fibonacci | 185.21 | 186.22 | 186.85 | 187.85 | 188.86 | 189.49 | 190.49 |
| Pivot points | S3 | S2 | S1 | PP | R1 | R2 | R3 |
|---|---|---|---|---|---|---|---|
| Standard | 184.11 | 186.49 | 190.76 | 193.14 | 197.41 | 199.79 | 204.06 |
| Camarilla | 193.19 | 193.80 | 194.41 | 195.02 | 195.63 | 196.24 | 196.85 |
| Woodie | 185.05 | 186.96 | 191.70 | 193.61 | 198.35 | 200.26 | 205.00 |
| Fibonacci | 186.49 | 189.03 | 190.60 | 193.14 | 195.68 | 197.25 | 199.79 |
| Pivot points | S3 | S2 | S1 | PP | R1 | R2 | R3 |
|---|---|---|---|---|---|---|---|
| Standard | 161.32 | 171.56 | 181.96 | 192.20 | 202.60 | 212.84 | 223.24 |
| Camarilla | 186.68 | 188.58 | 190.47 | 192.36 | 194.25 | 196.14 | 198.04 |
| Woodie | 161.40 | 171.60 | 182.04 | 192.24 | 202.68 | 212.88 | 223.32 |
| Fibonacci | 171.56 | 179.44 | 184.32 | 192.20 | 200.08 | 204.96 | 212.84 |
Numerical data
The following are the details of the technical indicators and moving averages that were collected to generate this technical analysis:
| RSI (14): | 49.62 | |
| MACD (12,26,9): | -0.6600 | |
| Directional Movement: | 1.97 | |
| AROON (14): | 35.72 | |
| DEMA (21): | 186.55 | |
| Parabolic SAR (0,02-0,02-0,2): | 185.65 | |
| Elder Ray (13): | -0.24 | |
| Super Trend (3,10): | 188.82 | |
| Zig ZAG (10): | 187.86 | |
| VORTEX (21): | 0.9600 | |
| Stochastique (14,3,5): | 58.19 | |
| TEMA (21): | 186.93 | |
| Williams %R (14): | -30.02 | |
| Chande Momentum Oscillator (20): | 2.13 | |
| Repulse (5,40,3): | 0.0600 | |
| ROCnROLL: | -1 | |
| TRIX (15,9): | -0.0900 | |
| Courbe Coppock: | 2.17 |
| MA7: | 189.90 | |
| MA20: | 193.03 | |
| MA50: | 192.39 | |
| MA100: | 182.27 | |
| MAexp7: | 187.41 | |
| MAexp20: | 187.70 | |
| MAexp50: | 189.39 | |
| MAexp100: | 190.89 | |
| Price / MA7: | -1.30% | |
| Price / MA20: | -2.90% | |
| Price / MA50: | -2.57% | |
| Price / MA100: | +2.84% | |
| Price / MAexp7: | +0.02% | |
| Price / MAexp20: | -0.14% | |
| Price / MAexp50: | -1.03% | |
| Price / MAexp100: | -1.81% |
News
Don't forget to follow the news on ANALOG DEVICES INC.. At the time of publication of this analysis, the latest news was as follows:
- Honeywell and Analog Devices Team Up to Drive Transformative Innovation, Beginning with Building Automation
- Thinking about trading options or stock in Macy's, DICK'S Sporting Goods, Novo Nordisk, Alphabet Inc, or Analog Devices?
- Analog Devices Reports Third Quarter Fiscal 2023 Financial Results
- Analog Devices, Inc. to Report Third Quarter Fiscal Year 2023 Financial Results on Wednesday, August 23, 2023
- Analog Devices Invests More Than $1 Billion in Semiconductor Facility Expansion in Oregon
About author
Online


Add a comment
Comments
0 comments on the analysis ANALOG DEVICES INC. - 1H