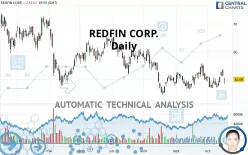
REDFIN CORP. - Daily - Technical analysis published on 10/19/2021 (GMT)
- 215
- 0
Click here for a new analysis!
- Timeframe : Daily
- - Analysis generated on
- Status : INVALID

Summary of the analysis

Additional analysis
Quotes
The REDFIN CORP. rating is 50.09 USD. The price registered a decrease of -2.61% on the session with the lowest point at 48.50 USD and the highest point at 50.78 USD. The deviation from the price is +3.28% for the low point and -1.36% for the high point.The Central Gaps scanner detects a bearish gap which is a sign that the sellers have taken the lead in the very short term.
Opening Gap DOWN
Type : Bearish
Timeframe : Openning
So that you have an overall view of the price change, here is a table showing the variations over several periods:
Near a new LOW record (1 month)
Type : Bearish
Timeframe : Weekly
Technical
Technical analysis of this Daily chart of REDFIN CORP. indicates that the overall trend is strongly bearish. The signals given by moving averages are 89.29% bearish. This strong bearish trend is confirmed by the strong signals currently being given by short-term moving averages. The Central Indicators market scanner is currently detecting several bearish and bullish signals that could impact this trend:
Moving Average bullish crossovers : MA20 & MA50
Type : Bullish
Timeframe : Daily
Bearish price crossover with adaptative moving average 20
Type : Bearish
Timeframe : Daily
In fact, of the 18 technical indicators analysed by Central Analyzer, 7 are bullish, 7 are neutral and 4 are bearish. Caution: the Central Indicators scanner currently detects an excess:
RSI indicator: bearish divergence
Type : Bearish
Timeframe : Daily
Pivot points : price is under support 1
Type : Neutral
Timeframe : Daily
Ichimoku : price is under the cloud
Type : Bearish
Timeframe : Daily
Price is back over the pivot point
Type : Bullish
Timeframe : Weekly
Central Patterns, the scanner specializing in chart patterns, did not identify any signals.
Central Candlesticks, the scanner specialised in Japanese candlesticks, detects a bearish signal that could support the hypothesis of a small drop in the very short term:
Bearish engulfing lines
Type : Bearish
Timeframe : Daily
| S3 | S2 | S1 | Price | R1 | R2 | R3 | |
|---|---|---|---|---|---|---|---|
| ProTrendLines | 23.66 | 32.21 | 47.03 | 50.09 | 51.10 | 60.76 | 71.85 |
| Change (%) | -52.77% | -35.70% | -6.11% | - | +2.02% | +21.30% | +43.44% |
| Change | -26.43 | -17.88 | -3.06 | - | +1.01 | +10.67 | +21.76 |
| Level | Intermediate | Minor | Major | - | Intermediate | Intermediate | Intermediate |
Pivot points can also be used to set your price objectives. Here is the price situation in relation to pivot points:
| Pivot points | S3 | S2 | S1 | PP | R1 | R2 | R3 |
|---|---|---|---|---|---|---|---|
| Standard | 46.52 | 47.51 | 48.80 | 49.79 | 51.08 | 52.07 | 53.36 |
| Camarilla | 49.46 | 49.67 | 49.88 | 50.09 | 50.30 | 50.51 | 50.72 |
| Woodie | 46.67 | 47.59 | 48.95 | 49.87 | 51.23 | 52.15 | 53.51 |
| Fibonacci | 47.51 | 48.38 | 48.92 | 49.79 | 50.66 | 51.20 | 52.07 |
| Pivot points | S3 | S2 | S1 | PP | R1 | R2 | R3 |
|---|---|---|---|---|---|---|---|
| Standard | 36.57 | 41.59 | 45.84 | 50.86 | 55.11 | 60.13 | 64.38 |
| Camarilla | 47.55 | 48.40 | 49.25 | 50.10 | 50.95 | 51.80 | 52.65 |
| Woodie | 36.20 | 41.40 | 45.47 | 50.67 | 54.74 | 59.94 | 64.01 |
| Fibonacci | 41.59 | 45.13 | 47.32 | 50.86 | 54.40 | 56.59 | 60.13 |
Numerical data
The following are the details of the technical indicators and moving averages that were collected to generate this technical analysis:
| RSI (14): | 49.19 | |
| MACD (12,26,9): | -0.1700 | |
| Directional Movement: | -1.33 | |
| AROON (14): | -42.86 | |
| DEMA (21): | 49.85 | |
| Parabolic SAR (0,02-0,02-0,2): | 47.39 | |
| Elder Ray (13): | -0.53 | |
| Super Trend (3,10): | 46.81 | |
| Zig ZAG (10): | 50.09 | |
| VORTEX (21): | 0.9600 | |
| Stochastique (14,3,5): | 55.30 | |
| TEMA (21): | 50.38 | |
| Williams %R (14): | -53.68 | |
| Chande Momentum Oscillator (20): | -0.01 | |
| Repulse (5,40,3): | -0.4200 | |
| ROCnROLL: | 2 | |
| TRIX (15,9): | -0.1000 | |
| Courbe Coppock: | 7.34 |
| MA7: | 49.95 | |
| MA20: | 50.56 | |
| MA50: | 50.39 | |
| MA100: | 55.04 | |
| MAexp7: | 50.37 | |
| MAexp20: | 50.21 | |
| MAexp50: | 51.49 | |
| MAexp100: | 54.35 | |
| Price / MA7: | +0.28% | |
| Price / MA20: | -0.93% | |
| Price / MA50: | -0.60% | |
| Price / MA100: | -8.99% | |
| Price / MAexp7: | -0.56% | |
| Price / MAexp20: | -0.24% | |
| Price / MAexp50: | -2.72% | |
| Price / MAexp100: | -7.84% |
About author

Online


Add a comment
Comments
0 comments on the analysis REDFIN CORP. - Daily