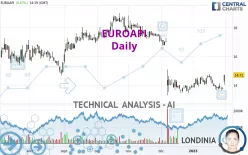
EUROAPI - Daily - Technical analysis published on 01/31/2023 (GMT)
- 217
- 0
Click here for a new analysis!
- Timeframe : Daily
- - Analysis generated on
- Status : LEVEL MAINTAINED

Summary of the analysis

Additional analysis
Quotes
The EUROAPI rating is 14.710 EUR. The price has increased by +6.67% since the last closing and was between 14.040 EUR and 14.730 EUR. This implies that the price is at +4.77% from its lowest and at -0.14% from its highest.A bullish gap was detected at the opening by the Central Gaps scanner. There are a lot of buyers and they have the upper hand in the very short term.
Opening Gap UP
Type : Bullish
Timeframe : Openning
Here is a more detailed summary of the historical variations registered by EUROAPI:
Near a new LOW record (1st january)
Type : Bearish
Timeframe : Weekly
Near a new LOW record (1 month)
Type : Bearish
Timeframe : Weekly
Technical
Technical analysis of this Daily chart of EUROAPI indicates that the overall trend is bearish. The signals given by moving averages are 71.43% bearish. This bearish trend could slow down given the neutral signals currently being given by short-term moving averages. An assessment of moving averages reveals several bullish signals that could impact this trend:
Bullish price crossover with Moving Average 20
Type : Bullish
Timeframe : Daily
Bullish price crossover with adaptative moving average 20
Type : Bullish
Timeframe : Daily
Bullish price crossover with adaptative moving average 50
Type : Bullish
Timeframe : Daily
An assessment of technical indicators shows a moderate bullish signal.
But beware of excesses. The Central Indicators scanner currently detects this:
Williams %R indicator is overbought : over -20
Type : Neutral
Timeframe : Daily
Pivot points : price is over resistance 3
Type : Neutral
Timeframe : Daily
Pivot points : price is over resistance 3
Type : Neutral
Timeframe : Weekly
RSI indicator is back over 50
Type : Bullish
Timeframe : Daily
Parabolic SAR indicator bullish reversal
Type : Bullish
Timeframe : Daily
Momentum indicator is back over 0
Type : Bullish
Timeframe : Daily
The Central Patterns scanner, which studies chart patterns, resistances and supports, has identified this signal:
Resistance of channel is broken
Type : Bullish
Timeframe : Daily
The Central Candlesticks scanner, specialised in Japanese candlesticks, did not identify any signals.
| S2 | S1 | Price | R1 | R2 | R3 | |
|---|---|---|---|---|---|---|
| ProTrendLines | 13.068 | 13.594 | 14.710 | 14.817 | 16.798 | 18.715 |
| Change (%) | -11.16% | -7.59% | - | +0.73% | +14.19% | +27.23% |
| Change | -1.642 | -1.116 | - | +0.107 | +2.088 | +4.005 |
| Level | Minor | Major | - | Intermediate | Intermediate | Minor |
Pivot points can also be used to set your price objectives. Here is the price situation in relation to pivot points:
| Pivot points | S3 | S2 | S1 | PP | R1 | R2 | R3 |
|---|---|---|---|---|---|---|---|
| Standard | 13.550 | 13.630 | 13.710 | 13.790 | 13.870 | 13.950 | 14.030 |
| Camarilla | 13.746 | 13.761 | 13.775 | 13.790 | 13.805 | 13.819 | 13.834 |
| Woodie | 13.550 | 13.630 | 13.710 | 13.790 | 13.870 | 13.950 | 14.030 |
| Fibonacci | 13.630 | 13.691 | 13.729 | 13.790 | 13.851 | 13.889 | 13.950 |
| Pivot points | S3 | S2 | S1 | PP | R1 | R2 | R3 |
|---|---|---|---|---|---|---|---|
| Standard | 13.023 | 13.327 | 13.543 | 13.847 | 14.063 | 14.367 | 14.583 |
| Camarilla | 13.617 | 13.665 | 13.712 | 13.760 | 13.808 | 13.855 | 13.903 |
| Woodie | 12.980 | 13.305 | 13.500 | 13.825 | 14.020 | 14.345 | 14.540 |
| Fibonacci | 13.327 | 13.525 | 13.648 | 13.847 | 14.045 | 14.168 | 14.367 |
| Pivot points | S3 | S2 | S1 | PP | R1 | R2 | R3 |
|---|---|---|---|---|---|---|---|
| Standard | 8.340 | 10.820 | 12.335 | 14.815 | 16.330 | 18.810 | 20.325 |
| Camarilla | 12.751 | 13.118 | 13.484 | 13.850 | 14.216 | 14.582 | 14.949 |
| Woodie | 7.858 | 10.579 | 11.853 | 14.574 | 15.848 | 18.569 | 19.843 |
| Fibonacci | 10.820 | 12.346 | 13.289 | 14.815 | 16.341 | 17.284 | 18.810 |
Numerical data
The following is the status of technical indicators and moving averages registered at the time this technical analysis was created:
| RSI (14): | 57.52 | |
| MACD (12,26,9): | -0.1690 | |
| Directional Movement: | 8.896 | |
| AROON (14): | -57.143 | |
| DEMA (21): | 13.866 | |
| Parabolic SAR (0,02-0,02-0,2): | 13.630 | |
| Elder Ray (13): | 0.289 | |
| Super Trend (3,10): | 14.684 | |
| Zig ZAG (10): | 14.680 | |
| VORTEX (21): | 0.9950 | |
| Stochastique (14,3,5): | 39.35 | |
| TEMA (21): | 14.096 | |
| Williams %R (14): | -7.49 | |
| Chande Momentum Oscillator (20): | 0.205 | |
| Repulse (5,40,3): | 3.8220 | |
| ROCnROLL: | -1 | |
| TRIX (15,9): | -0.2170 | |
| Courbe Coppock: | 4.03 |
| MA7: | 13.944 | |
| MA20: | 14.170 | |
| MA50: | 14.758 | |
| MA100: | 16.249 | |
| MAexp7: | 14.083 | |
| MAexp20: | 14.146 | |
| MAexp50: | 14.778 | |
| MAexp100: | 15.349 | |
| Price / MA7: | +5.49% | |
| Price / MA20: | +3.81% | |
| Price / MA50: | -0.33% | |
| Price / MA100: | -9.47% | |
| Price / MAexp7: | +4.45% | |
| Price / MAexp20: | +3.99% | |
| Price / MAexp50: | -0.46% | |
| Price / MAexp100: | -4.16% |
News
The latest news and videos published on EUROAPI at the time of the analysis were as follows:
- EUROAPI: Progressive restart of prostaglandin production at Budapest site
- EUROAPI’s Board of Directors Proposes Mattias Perjos as Independent Director
- Vitamin B12: EUROAPI to Invest €40 Million for a More Efficient and Sustainable Production Process in France
- EUROAPI Updates Its 2022 Financial Guidance
- EUROAPI to Reach 500 kg Peptide and Oligonucleotide Capacity Per Year in Frankfurt by 2025
About author
Online


Add a comment
Comments
0 comments on the analysis EUROAPI - Daily