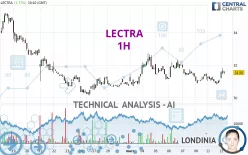
LECTRA - 1H - Technical analysis published on 03/12/2024 (GMT)
- 148
- 0
Click here for a new analysis!
- Timeframe : 1H
- - Analysis generated on
- Status : INVALID

Summary of the analysis

Additional analysis
Quotes
The LECTRA price is 31.55 EUR. The price has increased by +1.77% since the last closing and was between 31.20 EUR and 31.80 EUR. This implies that the price is at +1.12% from its lowest and at -0.79% from its highest.The Central Gaps scanner detects a bullish opening. A small advantage for buyers in the very short term.
Bullish opening
Type : Bullish
Timeframe : Openning
A study of price movements over other periods shows the following variations:
Near a new LOW record (1 month)
Type : Bearish
Timeframe : Weekly
Technical
Technical analysis of LECTRA in 1H shows an overall bullish trend. The signals returned by the moving averages are 67.86% bullish. This bullish trend is reinforced by the strong signals currently being given by short-term moving averages. An assessment of moving averages reveals a bullish signal that could impact this trend:
Bullish trend reversal : Moving Average 20
Type : Bullish
Timeframe : 1 hour
An assessment of technical indicators shows a strong bullish signal.
Caution: the Central Indicators scanner currently detects an excess:
CCI indicator is overbought : over 100
Type : Neutral
Timeframe : 1 hour
Previous candle closed over Bollinger bands
Type : Neutral
Timeframe : 1 hour
Pivot points : price is over resistance 1
Type : Neutral
Timeframe : 1 hour
Price is back over the pivot point
Type : Bullish
Timeframe : Weekly
The Central Patterns scanner, which studies chart patterns, resistances and supports, has identified this signal:
Near horizontal resistance
Type : Bearish
Timeframe : 1 hour
The Central Candlesticks scanner which studies Japanese candlesticks did not detect anything.
| S3 | S2 | S1 | Price | R1 | R2 | R3 | |
|---|---|---|---|---|---|---|---|
| ProTrendLines | 29.38 | 30.74 | 31.30 | 31.55 | 31.71 | 32.75 | 33.20 |
| Change (%) | -6.88% | -2.57% | -0.79% | - | +0.51% | +3.80% | +5.23% |
| Change | -2.17 | -0.81 | -0.25 | - | +0.16 | +1.20 | +1.65 |
| Level | Intermediate | Major | Major | - | Major | Minor | Minor |
To determine price objectives, it is also possible to use the pivot points. Here is the price position in relation to pivot points:
| Pivot points | S3 | S2 | S1 | PP | R1 | R2 | R3 |
|---|---|---|---|---|---|---|---|
| Standard | 30.27 | 30.53 | 30.77 | 31.03 | 31.27 | 31.53 | 31.77 |
| Camarilla | 30.86 | 30.91 | 30.95 | 31.00 | 31.05 | 31.09 | 31.14 |
| Woodie | 30.25 | 30.53 | 30.75 | 31.03 | 31.25 | 31.53 | 31.75 |
| Fibonacci | 30.53 | 30.72 | 30.84 | 31.03 | 31.22 | 31.34 | 31.53 |
| Pivot points | S3 | S2 | S1 | PP | R1 | R2 | R3 |
|---|---|---|---|---|---|---|---|
| Standard | 28.73 | 29.82 | 30.58 | 31.67 | 32.43 | 33.52 | 34.28 |
| Camarilla | 30.84 | 31.01 | 31.18 | 31.35 | 31.52 | 31.69 | 31.86 |
| Woodie | 28.58 | 29.74 | 30.43 | 31.59 | 32.28 | 33.44 | 34.13 |
| Fibonacci | 29.82 | 30.52 | 30.96 | 31.67 | 32.37 | 32.81 | 33.52 |
| Pivot points | S3 | S2 | S1 | PP | R1 | R2 | R3 |
|---|---|---|---|---|---|---|---|
| Standard | 23.82 | 26.98 | 28.87 | 32.03 | 33.92 | 37.08 | 38.97 |
| Camarilla | 29.36 | 29.82 | 30.29 | 30.75 | 31.21 | 31.68 | 32.14 |
| Woodie | 23.18 | 26.66 | 28.23 | 31.71 | 33.28 | 36.76 | 38.33 |
| Fibonacci | 26.98 | 28.91 | 30.10 | 32.03 | 33.96 | 35.15 | 37.08 |
Numerical data
The following are the details of the technical indicators and moving averages that were collected to generate this technical analysis:
| RSI (14): | 55.13 | |
| MACD (12,26,9): | -0.0200 | |
| Directional Movement: | 12.14 | |
| AROON (14): | 28.57 | |
| DEMA (21): | 31.23 | |
| Parabolic SAR (0,02-0,02-0,2): | 30.86 | |
| Elder Ray (13): | 0.27 | |
| Super Trend (3,10): | 30.88 | |
| Zig ZAG (10): | 31.50 | |
| VORTEX (21): | 0.9100 | |
| Stochastique (14,3,5): | 85.00 | |
| TEMA (21): | 31.27 | |
| Williams %R (14): | -30.00 | |
| Chande Momentum Oscillator (20): | 0.15 | |
| Repulse (5,40,3): | 0.6600 | |
| ROCnROLL: | 1 | |
| TRIX (15,9): | -0.0400 | |
| Courbe Coppock: | 0.63 |
| MA7: | 31.44 | |
| MA20: | 31.67 | |
| MA50: | 31.46 | |
| MA100: | 29.59 | |
| MAexp7: | 31.35 | |
| MAexp20: | 31.29 | |
| MAexp50: | 31.35 | |
| MAexp100: | 31.44 | |
| Price / MA7: | +0.35% | |
| Price / MA20: | -0.38% | |
| Price / MA50: | +0.29% | |
| Price / MA100: | +6.62% | |
| Price / MAexp7: | +0.64% | |
| Price / MAexp20: | +0.83% | |
| Price / MAexp50: | +0.64% | |
| Price / MAexp100: | +0.35% |
News
The last news published on LECTRA at the time of the generation of this analysis was as follows:
- Lectra: Monthly declaration of the total number of shares and voting rights composing the company's capital (at February 29th, 2024)
- LECTRA: Q4 and Full Year 2023 financial report available
- Lectra: Monthly declaration of the total number of shares and voting rights composing the company's capital (at January 31st, 2024)
- LECTRA: Monthly declaration of the total number of shares and voting rights composing the company's capital (at December 31st, 2023)
- LECTRA: Lectra announces the acquisition of the majority of the capital of Launchmetrics
About author
Online


Add a comment
Comments
0 comments on the analysis LECTRA - 1H