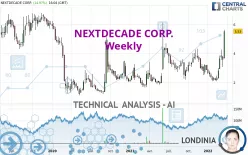
NEXTDECADE CORP. - Weekly - Technical analysis published on 03/25/2022 (GMT)
- 231
- 0
Click here for a new analysis!
- Timeframe : Weekly
- - Analysis generated on
- Status : INVALID

Summary of the analysis

Additional analysis
Quotes
The NEXTDECADE CORP. rating is 5.53 USD. The price is up +54.47% over 5 days with the lowest point at 3.66 USD and the highest point at 4.11 USD. The deviation from the price is +51.30% for the low point and +34.55% for the high point.A bullish gap was detected at the opening by the Central Gaps scanner. There are a lot of buyers and they have the upper hand in the very short term.
Opening Gap UP
Type : Bullish
Timeframe : Openning
So that you have an overall view of the price change, here is a table showing the variations over several periods:
New HIGH record (1st january)
Type : Bullish
Timeframe : Weekly
New HIGH record (1 month)
Type : Bullish
Timeframe : Weekly
Technical
Technical analysis of this Weekly chart of NEXTDECADE CORP. indicates that the overall trend is strongly bullish. 85.71% of the signals given by moving averages are bullish. The overall trend is supported by the strong bullish signals from short-term moving averages. The Central Indicators market scanner is currently detecting a bullish signal that could impact this trend:
Moving Average bullish crossovers : MA20 & MA50
Type : Bullish
Timeframe : Weekly
In fact, 15 technical indicators on 18 studied are currently bullish. Caution: the Central Indicators scanner currently detects an excess:
RSI indicator is overbought : over 70
Type : Neutral
Timeframe : Weekly
CCI indicator is overbought : over 100
Type : Neutral
Timeframe : Weekly
Williams %R indicator is overbought : over -20
Type : Neutral
Timeframe : Weekly
Pivot points : price is over resistance 3
Type : Neutral
Timeframe : Weekly
Ichimoku : price is over the cloud
Type : Bullish
Timeframe : Weekly
The analysis of the price chart with Central Patterns scanners does not return any result.
The presence of a bullish Japanese candlestick pattern detected by Central Candlesticks that could cause a very short term rebound was also detected:
Long white line
Type : Bullish
Timeframe : Weekly
| S3 | S2 | S1 | Price | R1 | R2 | |
|---|---|---|---|---|---|---|
| ProTrendLines | 3.17 | 4.09 | 4.90 | 5.53 | 5.56 | 6.62 |
| Change (%) | -42.68% | -26.04% | -11.39% | - | +0.54% | +19.71% |
| Change | -2.36 | -1.44 | -0.63 | - | +0.03 | +1.09 |
| Level | Major | Intermediate | Minor | - | Minor | Major |
Pivot points can also be used to set your price objectives. Here is the price situation in relation to pivot points:
| Pivot points | S3 | S2 | S1 | PP | R1 | R2 | R3 |
|---|---|---|---|---|---|---|---|
| Standard | 3.76 | 4.03 | 4.42 | 4.69 | 5.08 | 5.35 | 5.74 |
| Camarilla | 4.63 | 4.69 | 4.75 | 4.81 | 4.87 | 4.93 | 4.99 |
| Woodie | 3.82 | 4.06 | 4.48 | 4.72 | 5.14 | 5.38 | 5.80 |
| Fibonacci | 4.03 | 4.28 | 4.44 | 4.69 | 4.94 | 5.10 | 5.35 |
| Pivot points | S3 | S2 | S1 | PP | R1 | R2 | R3 |
|---|---|---|---|---|---|---|---|
| Standard | 2.37 | 2.71 | 3.15 | 3.49 | 3.93 | 4.27 | 4.71 |
| Camarilla | 3.37 | 3.44 | 3.51 | 3.58 | 3.65 | 3.72 | 3.80 |
| Woodie | 2.41 | 2.74 | 3.19 | 3.52 | 3.97 | 4.30 | 4.75 |
| Fibonacci | 2.71 | 3.01 | 3.20 | 3.49 | 3.79 | 3.98 | 4.27 |
| Pivot points | S3 | S2 | S1 | PP | R1 | R2 | R3 |
|---|---|---|---|---|---|---|---|
| Standard | 1.01 | 1.55 | 2.47 | 3.01 | 3.93 | 4.47 | 5.39 |
| Camarilla | 2.99 | 3.12 | 3.26 | 3.39 | 3.52 | 3.66 | 3.79 |
| Woodie | 1.20 | 1.65 | 2.66 | 3.11 | 4.12 | 4.57 | 5.58 |
| Fibonacci | 1.55 | 2.11 | 2.45 | 3.01 | 3.57 | 3.91 | 4.47 |
Numerical data
The following are the details of the technical indicators and moving averages that were collected to generate this technical analysis:
| RSI (14): | 69.09 | |
| MACD (12,26,9): | 0.1800 | |
| Directional Movement: | 20.68 | |
| AROON (14): | 57.14 | |
| DEMA (21): | 3.34 | |
| Parabolic SAR (0,02-0,02-0,2): | 2.28 | |
| Elder Ray (13): | 1.02 | |
| Super Trend (3,10): | 2.33 | |
| Zig ZAG (10): | 4.81 | |
| VORTEX (21): | 1.0100 | |
| Stochastique (14,3,5): | 81.52 | |
| TEMA (21): | 3.50 | |
| Williams %R (14): | -5.21 | |
| Chande Momentum Oscillator (20): | 1.96 | |
| Repulse (5,40,3): | 41.1200 | |
| ROCnROLL: | 1 | |
| TRIX (15,9): | -0.2000 | |
| Courbe Coppock: | 22.50 |
| MA7: | 3.90 | |
| MA20: | 3.66 | |
| MA50: | 2.87 | |
| MA100: | 3.07 | |
| MAexp7: | 3.60 | |
| MAexp20: | 3.18 | |
| MAexp50: | 3.04 | |
| MAexp100: | 3.22 | |
| Price / MA7: | +41.79% | |
| Price / MA20: | +51.09% | |
| Price / MA50: | +92.68% | |
| Price / MA100: | +80.13% | |
| Price / MAexp7: | +53.61% | |
| Price / MAexp20: | +73.90% | |
| Price / MAexp50: | +81.91% | |
| Price / MAexp100: | +71.74% |
News
The latest news and videos published on NEXTDECADE CORP. at the time of the analysis were as follows:
- NextDecade Comments on Recent Court Actions
- NextDecade Announces Issuance of Preferred Equity
- NextDecade Announces Executive Officer Appointments
- NextDecade and Project Canary Launch GHG Measurement and Certification Framework, First for Global LNG Industry
- NextDecade and Mitsubishi Heavy Industries America Execute Engineering Services Agreement for Carbon Capture at Rio Grande LNG Project in Texas
About author

Online


Add a comment
Comments
0 comments on the analysis NEXTDECADE CORP. - Weekly