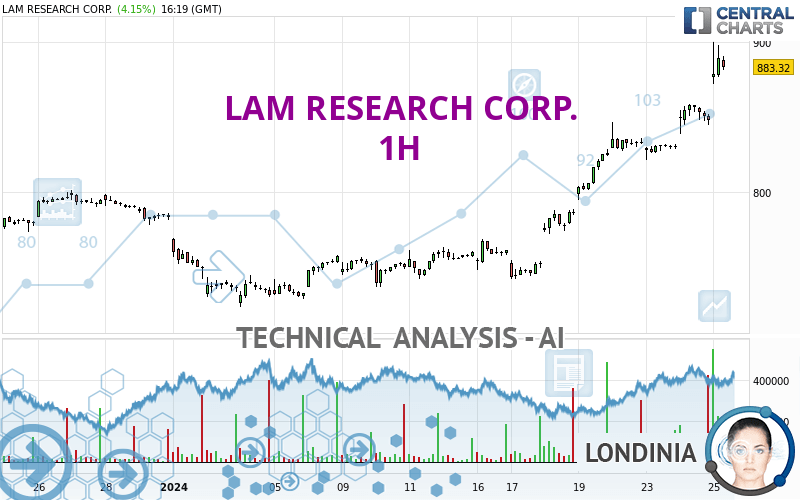
LAM RESEARCH CORP. - 1H - Technical analysis published on 01/25/2024 (GMT)
- 117
- 0
Click here for a new analysis!
- Timeframe : 1H
- - Analysis generated on
- Status : INVALID

Summary of the analysis

Additional analysis
Quotes
The LAM RESEARCH CORP. rating is 889.52 USD. The price registered an increase of +4.88% on the session with the lowest point at 872.39 USD and the highest point at 900.09 USD. The deviation from the price is +1.96% for the low point and -1.17% for the high point.The Central Gaps scanner detects a bullish gap which is a sign that buyers have taken the lead in the very short term.
Opening Gap UP
Type : Bullish
Timeframe : Openning
A study of price movements over other periods shows the following variations:
New HIGH record (5 years)
Type : Bullish
Timeframe : Weekly
New HIGH record (1 year)
Type : Bullish
Timeframe : Weekly
New HIGH record (1st january)
Type : Bullish
Timeframe : Weekly
New HIGH record (1 month)
Type : Bullish
Timeframe : Weekly
Technical
Technical analysis of this 1H chart of LAM RESEARCH CORP. indicates that the overall trend is strongly bullish. 92.86% of the signals given by moving averages are bullish. The overall trend is supported by the strong bullish signals from short-term moving averages. The Central Indicators scanner does not detect any result on moving averages that would impact this trend.
Technical indicators are strongly bullish, suggesting that the price increase should continue.
Caution: the Central Indicators scanner currently detects an excess:
RSI indicator is overbought : over 80
Type : Neutral
Timeframe : 1 hour
CCI indicator is overbought : over 100
Type : Neutral
Timeframe : 1 hour
Previous candle closed over Bollinger bands
Type : Neutral
Timeframe : 1 hour
RSI indicator: bearish divergence
Type : Bearish
Timeframe : 1 hour
Williams %R indicator is overbought : over -20
Type : Neutral
Timeframe : 1 hour
Pivot points : price is over resistance 2
Type : Neutral
Timeframe : Weekly
Pivot points : price is over resistance 3
Type : Neutral
Timeframe : 1 hour
The Central Patterns scanner, which studies chart patterns, resistances and supports, has identified this signal:
Resistance of channel is broken
Type : Bullish
Timeframe : 1 hour
The Central Candlesticks scanner which studies Japanese candlesticks did not detect anything.
| S3 | S2 | S1 | Price | |
|---|---|---|---|---|
| ProTrendLines | 821.47 | 846.61 | 858.64 | 889.52 |
| Change (%) | -7.65% | -4.82% | -3.47% | - |
| Change | -68.05 | -42.91 | -30.88 | - |
| Level | Minor | Intermediate | Intermediate | - |
Attention could also be paid to pivot points to set price objectives:
| Pivot points | S3 | S2 | S1 | PP | R1 | R2 | R3 |
|---|---|---|---|---|---|---|---|
| Standard | 818.02 | 828.24 | 838.20 | 848.42 | 858.38 | 868.60 | 878.56 |
| Camarilla | 842.61 | 844.46 | 846.31 | 848.16 | 850.01 | 851.86 | 853.71 |
| Woodie | 817.89 | 828.18 | 838.07 | 848.36 | 858.25 | 868.54 | 878.43 |
| Fibonacci | 828.24 | 835.95 | 840.71 | 848.42 | 856.13 | 860.89 | 868.60 |
| Pivot points | S3 | S2 | S1 | PP | R1 | R2 | R3 |
|---|---|---|---|---|---|---|---|
| Standard | 682.82 | 712.41 | 769.37 | 798.96 | 855.92 | 885.51 | 942.47 |
| Camarilla | 802.52 | 810.45 | 818.39 | 826.32 | 834.25 | 842.19 | 850.12 |
| Woodie | 696.50 | 719.25 | 783.05 | 805.80 | 869.60 | 892.35 | 956.15 |
| Fibonacci | 712.41 | 745.48 | 765.90 | 798.96 | 832.03 | 852.45 | 885.51 |
| Pivot points | S3 | S2 | S1 | PP | R1 | R2 | R3 |
|---|---|---|---|---|---|---|---|
| Standard | 595.97 | 640.64 | 711.95 | 756.62 | 827.93 | 872.60 | 943.91 |
| Camarilla | 751.37 | 762.00 | 772.63 | 783.26 | 793.89 | 804.52 | 815.16 |
| Woodie | 609.29 | 647.30 | 725.27 | 763.28 | 841.25 | 879.26 | 957.23 |
| Fibonacci | 640.64 | 684.94 | 712.32 | 756.62 | 800.92 | 828.30 | 872.60 |
Numerical data
The following are the details of the technical indicators and moving averages that were collected to generate this technical analysis:
| RSI (14): | 81.39 | |
| MACD (12,26,9): | 18.6400 | |
| Directional Movement: | 37.74 | |
| AROON (14): | 85.71 | |
| DEMA (21): | 873.75 | |
| Parabolic SAR (0,02-0,02-0,2): | 843.21 | |
| Elder Ray (13): | 28.76 | |
| Super Trend (3,10): | 852.49 | |
| Zig ZAG (10): | 887.77 | |
| VORTEX (21): | 1.1400 | |
| Stochastique (14,3,5): | 79.91 | |
| TEMA (21): | 877.99 | |
| Williams %R (14): | -17.26 | |
| Chande Momentum Oscillator (20): | 56.36 | |
| Repulse (5,40,3): | 0.1200 | |
| ROCnROLL: | 1 | |
| TRIX (15,9): | 0.2800 | |
| Courbe Coppock: | 9.14 |
| MA7: | 823.65 | |
| MA20: | 781.13 | |
| MA50: | 748.23 | |
| MA100: | 689.56 | |
| MAexp7: | 870.65 | |
| MAexp20: | 849.76 | |
| MAexp50: | 820.03 | |
| MAexp100: | 795.80 | |
| Price / MA7: | +8.00% | |
| Price / MA20: | +13.88% | |
| Price / MA50: | +18.88% | |
| Price / MA100: | +29.00% | |
| Price / MAexp7: | +2.17% | |
| Price / MAexp20: | +4.68% | |
| Price / MAexp50: | +8.47% | |
| Price / MAexp100: | +11.78% |
News
The latest news and videos published on LAM RESEARCH CORP. at the time of the analysis were as follows:
- Lam Research Corporation Reports Financial Results for the Quarter Ended December 24, 2023
- Lam Research Corporation Announces December 2023 Quarter Financial Conference Call
- Lam Research Earns Spot on the Dow Jones Sustainability Index for North America for the Third Consecutive Year
- Lam Research Corporation Announces Participation at Upcoming Conference
- Lam Research Corporation Declares Quarterly Dividend
About author
Online


Add a comment
Comments
0 comments on the analysis LAM RESEARCH CORP. - 1H