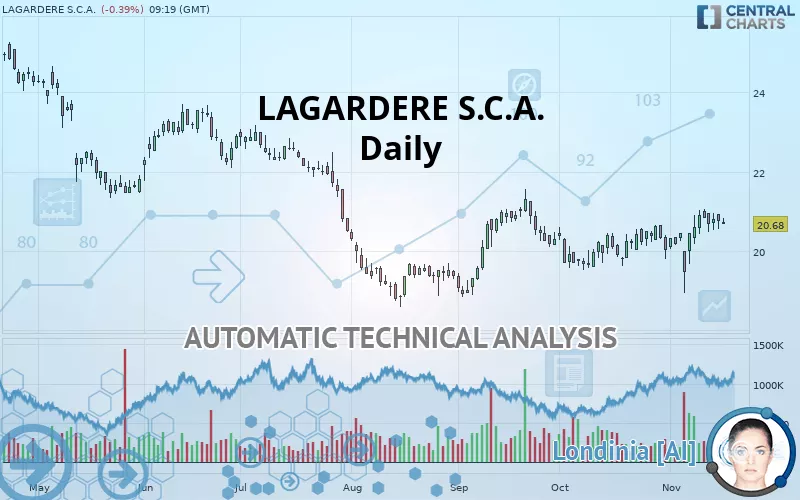
LAGARDERE SA - Daily - Technical analysis published on 11/18/2019 (GMT)
- 319
- 0
- Who voted?
Click here for a new analysis!
- Timeframe : Daily
- - Analysis generated on
- Status : INVALID

Summary of the analysis

Additional analysis
Quotes
The LAGARDERE S.C.A. rating is 20.68 EUR. The price is lower by -0.39% since the last closing and was traded between 20.68 EUR and 20.82 EUR over the period. The price is currently at 0% from its lowest and -0.67% from its highest.The Central Gaps scanner detects a bearish opening. A small advantage for sellers in the very short term.
Bearish opening
Type : Bearish
Timeframe : Openning
So that you have an overall view of the price change, here is a table showing the variations over several periods:
Near a new HIGH record (1 month)
Type : Bullish
Timeframe : Weekly
Technical
A technical analysis in Daily of this LAGARDERE S.C.A. chart shows a bullish trend. The signals returned by the moving averages are 67.86% bullish. This bullish trend is reinforced by the strong signals currently being given by short-term moving averages. There is no crossing of moving average by the price or crossing of moving averages between themselves.
The technical indicators are bullish. There is still some doubt about the price increase.
Caution: the Central Indicators scanner currently detects an excess:
CCI indicator is overbought : over 100
Type : Neutral
Timeframe : Daily
CCI indicator: bearish divergence
Type : Bearish
Timeframe : Daily
MACD indicator: bearish divergence
Type : Bearish
Timeframe : Daily
Williams %R indicator is overbought : over -20
Type : Neutral
Timeframe : Daily
Price is back over the pivot point
Type : Bullish
Timeframe : Weekly
An analysis of the price chart with the Central Patterns scanner (detector of chart patterns and resistances and supports) shows several results that can have an impact on the price change:
Near resistance of channel
Type : Bearish
Timeframe : Daily
Near horizontal support
Type : Bullish
Timeframe : Daily
The Central Candlesticks scanner, specialised in Japanese candlesticks, did not identify any signals.
| S3 | S2 | S1 | Price | R1 | R2 | R3 | |
|---|---|---|---|---|---|---|---|
| ProTrendLines | 18.76 | 19.64 | 20.62 | 20.68 | 21.46 | 22.35 | 23.56 |
| Change (%) | -9.28% | -5.03% | -0.29% | - | +3.77% | +8.08% | +13.93% |
| Change | -1.92 | -1.04 | -0.06 | - | +0.78 | +1.67 | +2.88 |
| Level | Major | Intermediate | Intermediate | - | Minor | Major | Intermediate |
Pivot points can also be used to set your price objectives. Here is the price situation in relation to pivot points:
| Pivot points | S3 | S2 | S1 | PP | R1 | R2 | R3 |
|---|---|---|---|---|---|---|---|
| Standard | 20.19 | 20.37 | 20.57 | 20.75 | 20.95 | 21.13 | 21.33 |
| Camarilla | 20.66 | 20.69 | 20.73 | 20.76 | 20.80 | 20.83 | 20.87 |
| Woodie | 20.19 | 20.38 | 20.57 | 20.76 | 20.95 | 21.14 | 21.33 |
| Fibonacci | 20.37 | 20.52 | 20.61 | 20.75 | 20.90 | 20.99 | 21.13 |
| Pivot points | S3 | S2 | S1 | PP | R1 | R2 | R3 |
|---|---|---|---|---|---|---|---|
| Standard | 19.79 | 20.11 | 20.43 | 20.75 | 21.07 | 21.39 | 21.71 |
| Camarilla | 20.58 | 20.64 | 20.70 | 20.76 | 20.82 | 20.88 | 20.94 |
| Woodie | 19.80 | 20.11 | 20.44 | 20.75 | 21.08 | 21.39 | 21.72 |
| Fibonacci | 20.11 | 20.35 | 20.50 | 20.75 | 20.99 | 21.14 | 21.39 |
| Pivot points | S3 | S2 | S1 | PP | R1 | R2 | R3 |
|---|---|---|---|---|---|---|---|
| Standard | 18.32 | 18.91 | 19.47 | 20.06 | 20.62 | 21.21 | 21.77 |
| Camarilla | 19.70 | 19.81 | 19.92 | 20.02 | 20.13 | 20.23 | 20.34 |
| Woodie | 18.30 | 18.90 | 19.45 | 20.05 | 20.60 | 21.20 | 21.75 |
| Fibonacci | 18.91 | 19.35 | 19.62 | 20.06 | 20.50 | 20.77 | 21.21 |
Numerical data
The following is the status of technical indicators and moving averages registered at the time this technical analysis was created:
| RSI (14): | 54.09 | |
| MACD (12,26,9): | 0.1500 | |
| Directional Movement: | -4.19 | |
| AROON (14): | 28.57 | |
| DEMA (21): | 20.67 | |
| Parabolic SAR (0,02-0,02-0,2): | 19.49 | |
| Elder Ray (13): | 0.18 | |
| Super Trend (3,10): | 19.37 | |
| Zig ZAG (10): | 20.78 | |
| VORTEX (21): | 1.0900 | |
| Stochastique (14,3,5): | 86.85 | |
| TEMA (21): | 20.79 | |
| Williams %R (14): | -13.15 | |
| Chande Momentum Oscillator (20): | 0.76 | |
| Repulse (5,40,3): | 0.2900 | |
| ROCnROLL: | 1 | |
| TRIX (15,9): | 0.0800 | |
| Courbe Coppock: | 3.51 |
| MA7: | 20.76 | |
| MA20: | 20.44 | |
| MA50: | 20.38 | |
| MA100: | 20.51 | |
| MAexp7: | 20.68 | |
| MAexp20: | 20.48 | |
| MAexp50: | 20.38 | |
| MAexp100: | 20.63 | |
| Price / MA7: | -0.39% | |
| Price / MA20: | +1.17% | |
| Price / MA50: | +1.47% | |
| Price / MA100: | +0.83% | |
| Price / MAexp7: | -0% | |
| Price / MAexp20: | +0.98% | |
| Price / MAexp50: | +1.47% | |
| Price / MAexp100: | +0.24% |
News
Don"t forget to follow the news on LAGARDERE S.C.A.. At the time of publication of this analysis, the latest news was as follows:
- Lagardère SCA: Disclosure of Trading in Own Shares from 4 October to 11 October
- Lagardère Seeks Damages of €84 Million From Activist Fund Amber Capital
- Lagardère Places a Seven-year Bond Issue For €500 Million
- Lagardère SCA: Disclosure of Trading in Own Shares From 25 September to 3 October
- LAGARDERE SCA: Monthly Information Relating to the Total Number of Voting Rights and Shares Making up the Share Capital
About author

Online


Add a comment
Comments
0 comments on the analysis LAGARDERE SA - Daily